I love the first day of the year (January 1) for a rather unusual reason. The thing I’m most excited about with each new year is the gift of getting to analyze all of my tracking data and data exhaust from the last year. Besides the fun of seeing all of the charts and graphs, I get to quantify a whole host of questions about myself and reflect on years past and the year ahead.
Let’s dive into the data and kick off a bit of temporal reflection.
Here are a few of my key time indictors (KTIs) from the last year:
- SLEEP: 7h 27 minutes of each day I spent sleeping.
- COMPUTER USAGE: 5h 18 minutes per day I was working on my computer. With distracting sites block and optimized for deep work, computer time is where I get stuff done.
- PHONE TIME: 1h 26 minutes per day I am on my phone. Excluding maps, GPS and some email and chat, mostly negative time usage.
- TABLET TIME: 52 minutes per day (mostly in the evenings) I was using my iPad. About 50/50 positive (book reading and educational videos) and negative (Netflix).
Along with my task tracking and a host of other self-tracking, I track my time. Using a few different tools and a logging habit during my weekly review, I get a record of my computer time, phone and tablet usage, exercise and sleep. Using my time tracking data, I then can aggregate, visualize and answer the question: How did I spend my time over the last year? Where did my time go?
Each week is an evolving pattern of time spent on something or other. Unfortunately, due to a cognitive bias, we tend to better remember uncompleted tasks and forget the details of once a task is. The result is based on our biological memories alone we can feel like we aren’t getting anything done. Referred to as the Zeigarnik Effect, uncompleted jobs-to-be-done linger in our minds and distract us, while completed work quickly slips out of short-term memory.
Because I have saved logs and captured data, I have nearly perfect memory of what I worked on and where much of my time goes in a year. This has enabled me to modify my behavior over time, tackle personal, professional and health-related challenges, and acheive my goals. Self-tracking or quantified self is not a magic bullet though. Just getting the data is often just the first steps. You often need to reflect on yourself and your behavior, set and revise your goals and iterate and improve (kaizen).
PS – Read Ultimate Guide to How to Track Your Time and Life for a step-by-step method. I’ve been reflecting on my time publicly for a few years. If you are interested in seeing my past time logs and time reflections, check out my year in time posts from 2022, 2021, 2020, 2019 and 2018. For more on self-tracking and my other year in data art/reflection/tech work, check out my “Track Everything” blog post series.
[Summary View]
My Total Time: Week by Week
Each week each and every one of us gets 168 hours. If we exclude an assumed 8 hours of sleep, then we get more like 112 hours to live, work, exercise, socialize, etc.
Here is a week-by-week breakdown of my biggest buckets of time. I’ve coded blue as my time sleeping and red as time usage on computer, two my largest allocations of time in any day, week or year.
![]()
As a point of reference, 56 hours equals 8 hours of sleep per night, and in general it looks like my weekly sleep (in blue) was above 50h or above 7h15 per night.
Even just a cursory glance at this chart reveals a few up’s and down’s in my sleep, computer usage and more. I can spot period of travel, holidays and/or sicknesses, like Weeks 7, 8, 30, 50. Overall, it’s pretty patterns in the big blocks.
Total Captured vs Unknown Time
![]()
Roughly 60 hours per week doesn’t get tracked, which would include eating, chores, cooking, socializing, reading and movie/TV watching.
[Part 1] Device Time: Computer, Phone, Tablet
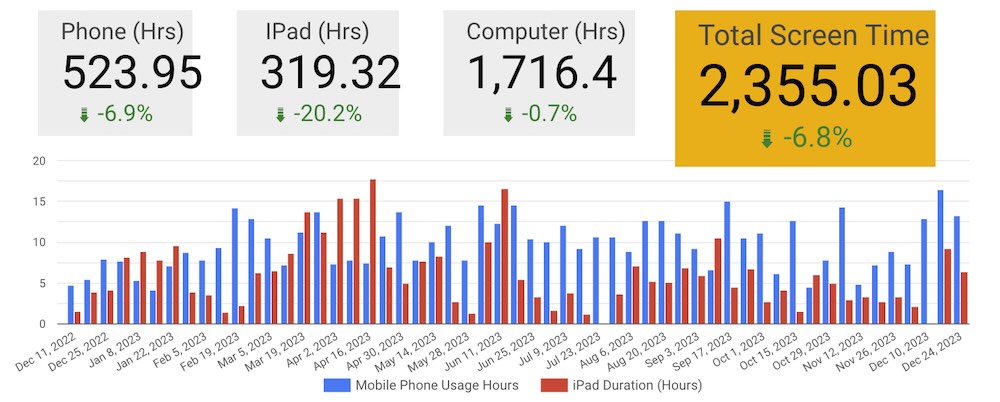
My Total Screen Time: 2,355 hours
NOTE: This data viz is a snapshot from my weekly review data so the numbers are slightly different due to weeks break up a given year.
Compared to my total screentime of 2,471.17 hours in 2022, I spent “just” 2,355 hours on screen-devices (excluding Kindle and TV/projector). That’s a drop of 4.7% and adds up 116 hours. Decreasing my screentime by that amount, translates to possibly enough time to read an additional 19 or 20 books in a year.
In total, last year I spent 523.95 hours on my iPhone and 319.32 on Tablet/iPad. Averaging this out, this translates to 1h 26 minutes per day on my phone and 52 minutes per day on my tablet. Even though this seems reasonable, it’s still a lot of time (at least to me).
Non-computer screentime is an area I’ve spent many years trying to modify my behaviors. It has been hard. Setting intentions, tracking screentime and embracing FOMO (on social media) have all helped me disengage from my phone and break a moderate smartphone addiction. For me seeing such a huge time savings and recognizing just how much meaningful time this delivers to me is inspiring and empowering.
My Total Computer Time: 1,711.2 hours
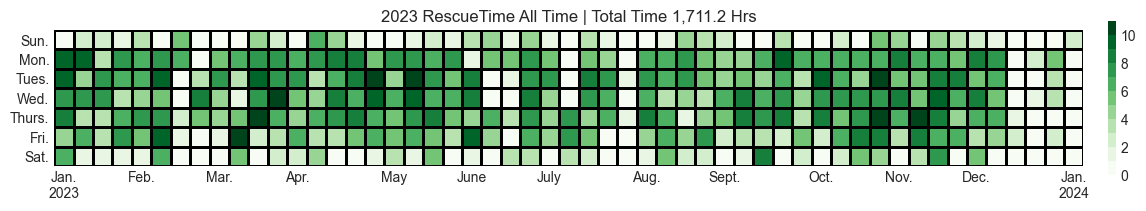
According to my RescueTime logs, I had 327 total computer days, i.e. days spent on my computer that were tracked. This was 16 less computer days than last year.
My Daily Average (of tracked days) was 5.3 hrs (compared with 5 hrs per day last year), meaning I spent few days on computer in total but on computer days I spent more time.
I logged 1711.2 hours on my computer last year, which interestingly was just 3 hours more than 2022.
This yearly heat map of productive time shows a bit more clarity into non-work, non-computer days:
Overall, I’m happy that I took more computer free days in 2023 and it appears that it had little or no negative impact on my overall output and time input.
Most Productive Computer Days = Monday to Thursday
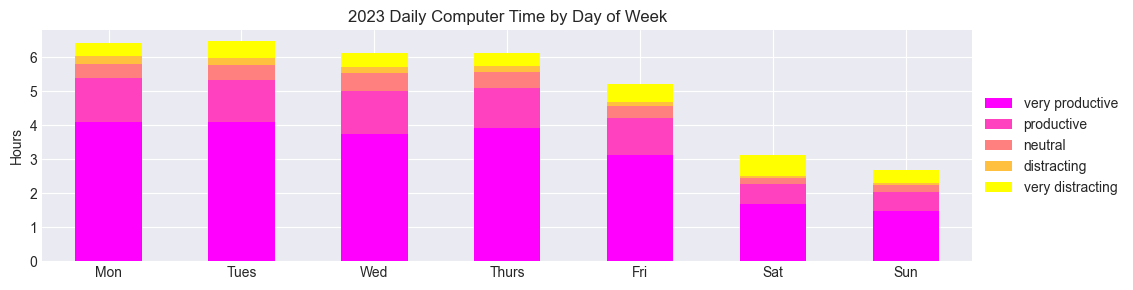
Monday, Tuesday, Wednesday and Thursday were all remarkably similar in terms of my productive computer usage. This is surpising result, compared to past few years where Wednesday was noticably my most productive day of the week.
Here is a comparison chart based on project time focus by day of week:
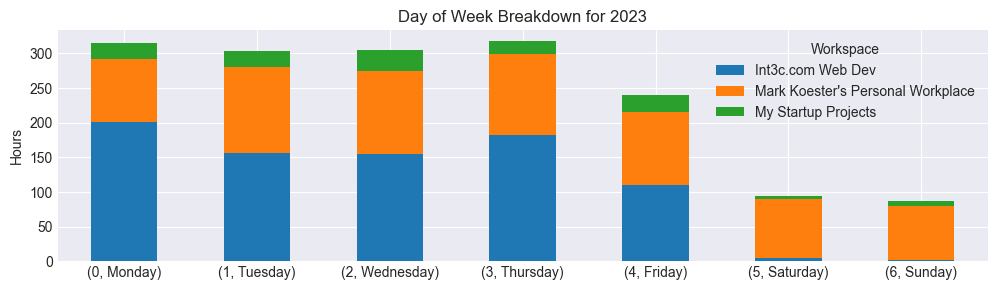
All in all, I’m glad I’m showing up on the core of my week more consistently. This is a solid trend to continue with, since it means I can expect steady output as long as I show up each and every day from Monday to Friday (afternoon).
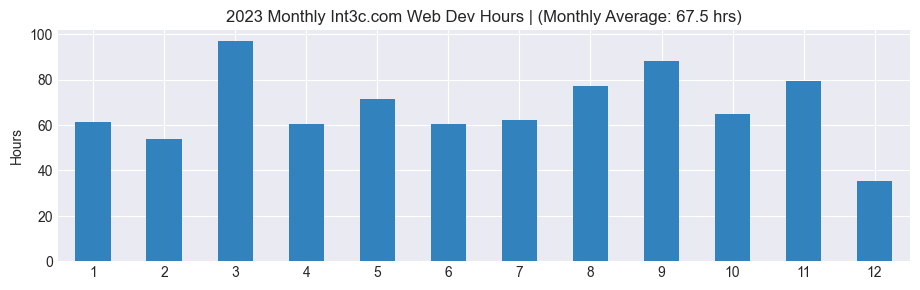
Top Computer Usage Months: October and November
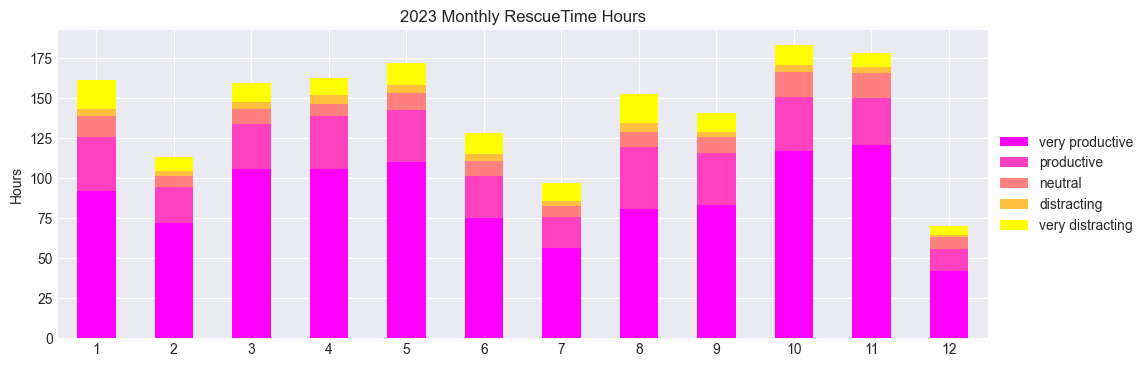
It’s interesting to see the flow of a year through data like this. I would not have expected such differences, especially in view of greater consistency last year. December was definitely my biggest drop and was intended as a period to recharge. July involved some family travels.
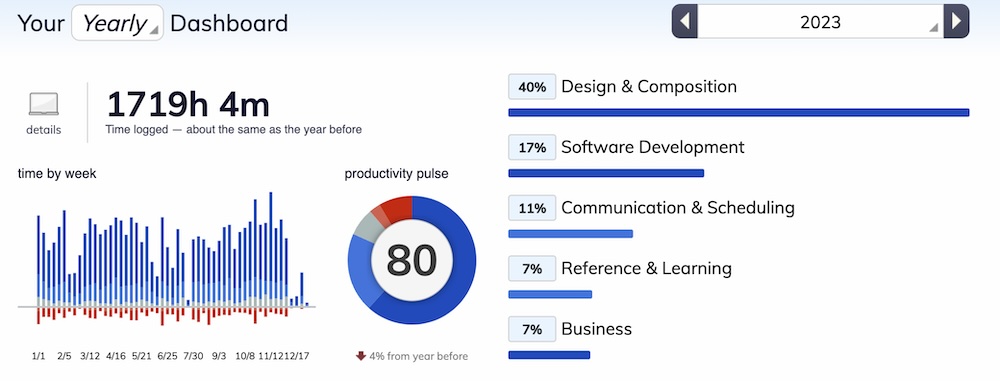
Yearly productivity: How does this year compare with past ones?
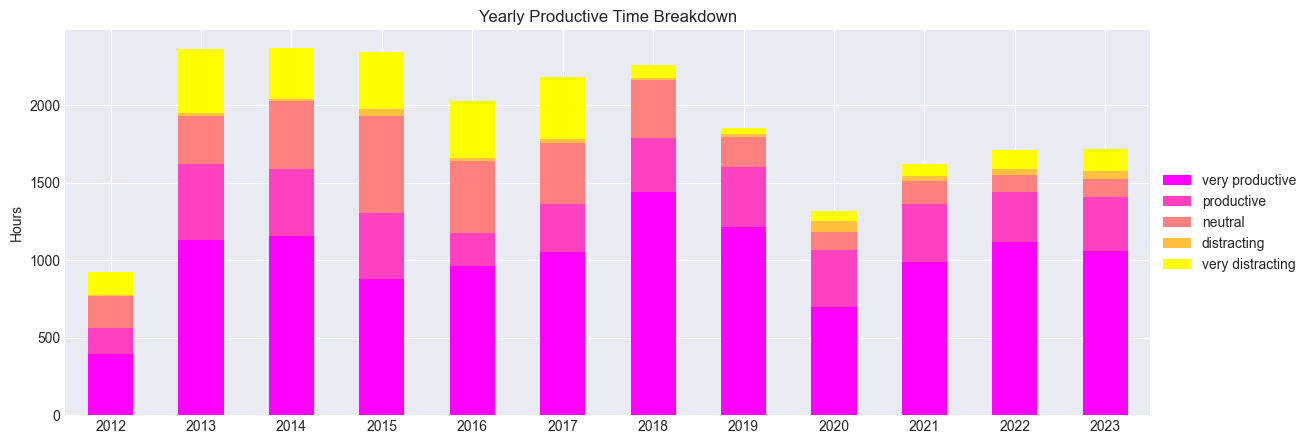
Last three years show pretty consistent overall computer usage and limited distraction time, especially when compared with a decade ago.
I have generally “de-trained” myself from using my computer for distraction and entertainment. I have a few tools that block distracting websites and time tracking triggers that nudge me if I spend too much time on distracting sites and tools.
Top App Categories = Writing, Software Development and Audio Editing
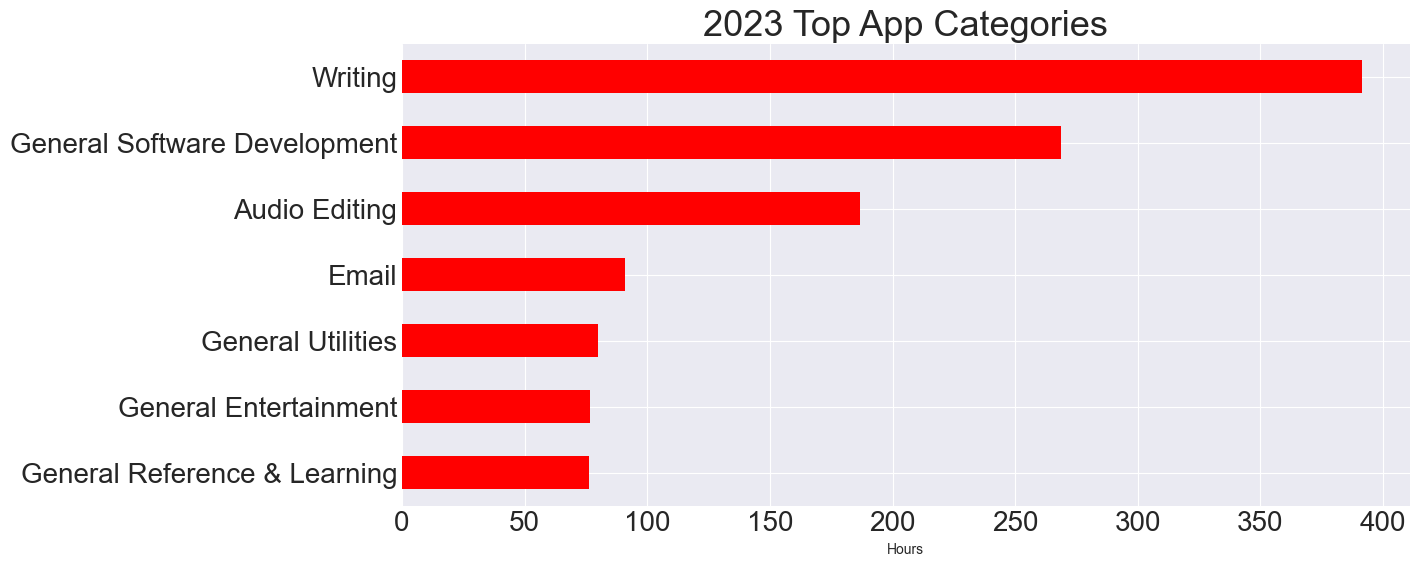
In 2023, my top 7 categories for softare tool usage was:
- 391.3 hrs on Writing
- 268.6 hrs on General Software Development
- 186.7 hrs on Audio Editing
- 90.8 hrs on Email
- 80.0 hrs on General Utilities
- 76.5 hrs on General Entertainment
- 76.3 hrs on General Reference & Learning
We shouldn’t negate just how important focusing and spending time in your key output tools. If you have the relevant skills and then show up and deliver outputs, you can consider yourself a productive knowledge worker. In my case as product designer, software engineer, music producer and writer, I’m happy to see those as my top tools used.
While I use writing tools for more than just creative writing, I’m really glad to see that as my top categories since whether it’s note-taking, planning or actual writing, time spent writing can drive better thinking, better decision making and hopefully better outcomes too.
Interestingly most of my software projects are in building, maintenance or optimization phases, so I have more time in my IDE and software tools and less on a design tool like Figma.
I also spent a lot less time on presentations and email. For example, email time dropped from 137 hours in 2022 to just 91 hours in 2023. Admittedly I do a bit of “light” emailing and chat on phone, but regardless it is a positive trendline and translates to nearly a 40-hour work week of less email!
[Part 2] Project Time
Project time tracking is one of the most high-impact tracking behaviors I do. Specifically I use a manual time tracking tool called Toggl to track my projects and goals. While it’s mostly prefilled, I still have to set the project and task and then manually start and stop a timer to track my time. It often only takes a few seconds. The immediate benefit is a set an intention on my time in-the-moment. The secondary and later benefit is I have a log to see where my time went as part of a day, week or year.
If I could recommend one behavior change it would be project time tracking. Setting a clear intention in the moment and having a log of where you time went adds up to an incredible behavior change toolkit, because you can explicitly set intentions in the moment and track progress afterwards.
Let’s review my project time over the last year with an emphasis on a few key iniatives (music production and writing).
My Project Time: 1661 total project hours
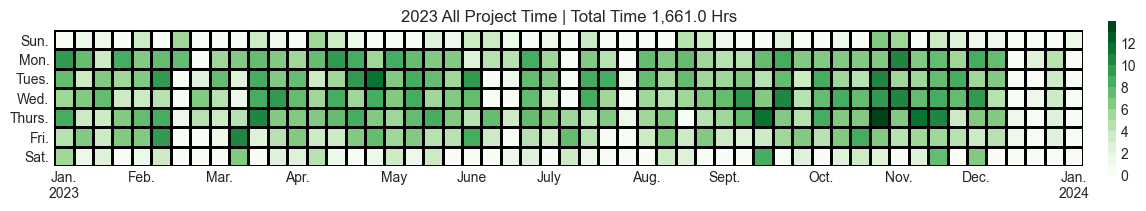
Based on this heat map, I see a pretty consitent display of showing up Monday to Thursday with less time input on Friday’s, Saturday’s and Sunday’s. This is largely aligned with my intentions.
According to my Toggl time logs, I logged 1661 hours on a range of projects and tasks. Surprisingly, compared to last year I decreased my project time 157 hours.
Project time is a big time indicator for me. I believe we are each given a certain amount of energy and cognitive capacity each day.
Total project time captures my best guess at what I have to give in a year. Based on previous years, I can roughly estimate 1675 to 2000 possible project hours of cognitive capacity in year. Based on days off, it’s normal to see what I hit this past year. That said, I’d like to strive towards hitting this target more fully in years ahead.
Breakdown Workspaces Time:
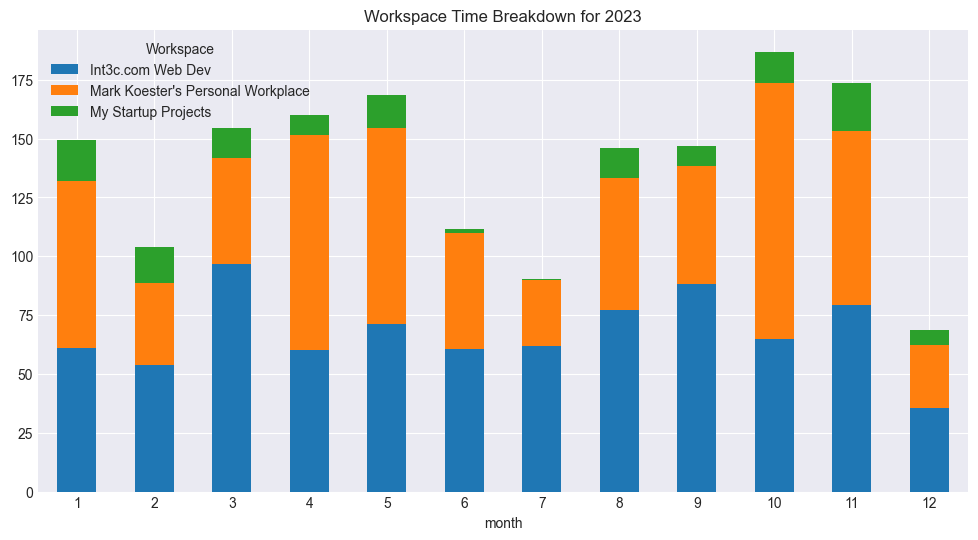
I divide my time logging and overall work into three broad and somewhat overlapping buckets:
- Personal Time includes organizational work, task management weekly reviews, studies, creative writing, and music.
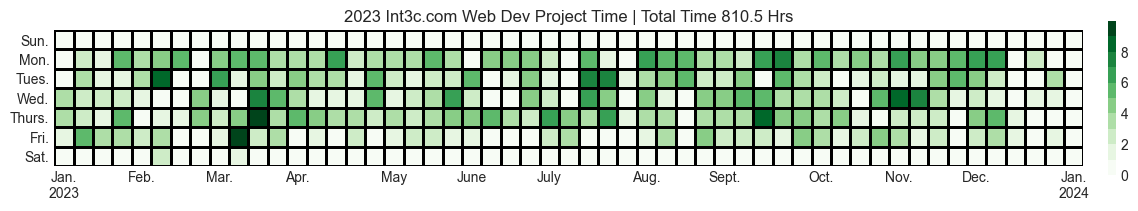
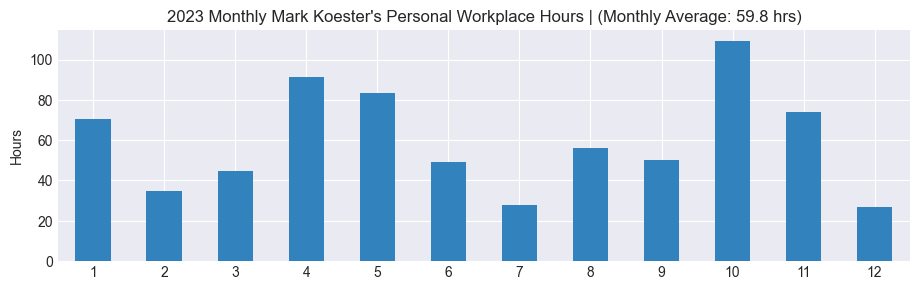
- Client Work, namely Development, Design and Growth Hacking. This includes paid consulting work as well as some misc work related to that like meetings and sales.
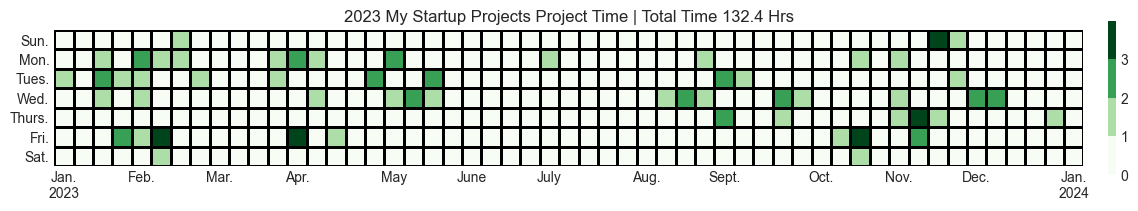
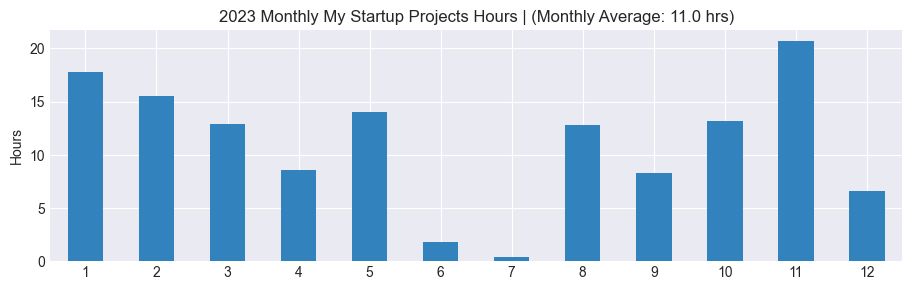
- My Startup Projects relates to existing and new projects I build, design and develop as well as some side hustles I operate.
Here is how my project time got most broadly split up:
- Client Work: 810 hours 31 minutes.
- Personal Time: 718 hours and 3 minutes.
- My Startup Projects: 132 hours and 25 minutes
Compared to last year, there were some shifts. I decreased my client time but increased my personal time. My startup time dropped by half.
Breakdown of My General Time Allotment:
Client Consulting: Design, Development and Growth Marketing
Personal Projects, Writing, Music Production and Studies

Startup Projects:
The Big Blocks of My Project Time
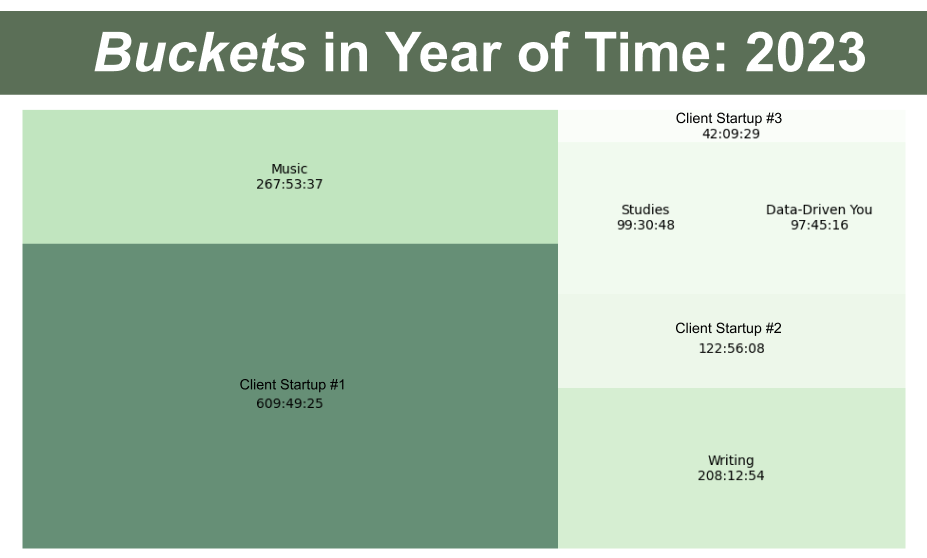
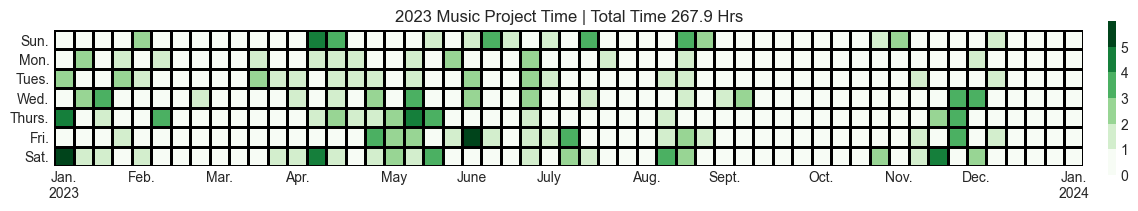
Music Learning, Production and Creation Time: 267 hours
Under the name of Stellar Mammals (StellarMammals.com), I released 30 songs in 2023 and two full length albums, Symbolic Wonderlands and Cosmic Coastlines.
Many factors can affect your ability to create and ship your creative work. You definitely need to learn and cultivate certain skills. In From Zero to Album, I talk about recognizing different stages in my own learning journey as a music producer. You also need to write songs and create demos, which I describe in my 30-day song writing challenge post. I also find having a checklist or spreadsheet can help cultivate creative organization and finish creative work, like finishing an album. All of this should be centered on delivering what I call Tangible Artistic Creations (TACs).
But did you do the work? More than anything though, as an artist you have to do the work. You have to put in the time.
In 2023, I put in 267 hours on my music and music in general. Even though I released a lot more music, this was 46 fewer hours than 2022. This could be calculated as nearly 9 hours per released song. How is this even possible?
I believe part of this came from where my time went. Here were my top music-related tasks and time allotments:
- Music Production Jamming: 52 hours and 48 minutes
- Album Production - Reworking: 20 hours and 1 minute
- Album Production Work: 18 hours and 3 minutes
Put another way, of just this splice of time (90 hours), 58% was on writing and producing new songs and 42% was on either editing or finishing songs or completing album overall.
Now that I largely have developed my music producer skills, my central focus should be either writing new songs or finishing songs. For example, I strive to limit my music learning time to only 10-15% of my overall music time. This results in a heavy emphasis on writing and releasing music, which I consider fundamental for my stage as a musical creative.
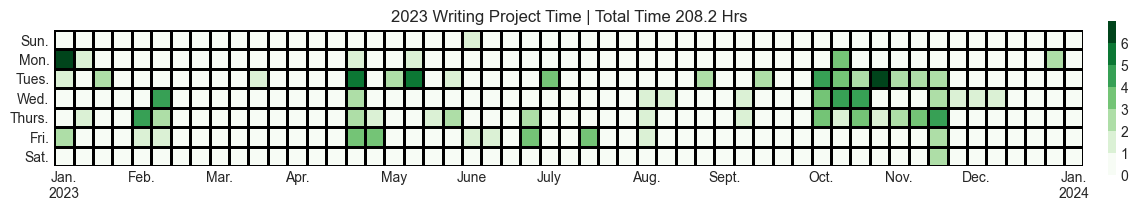
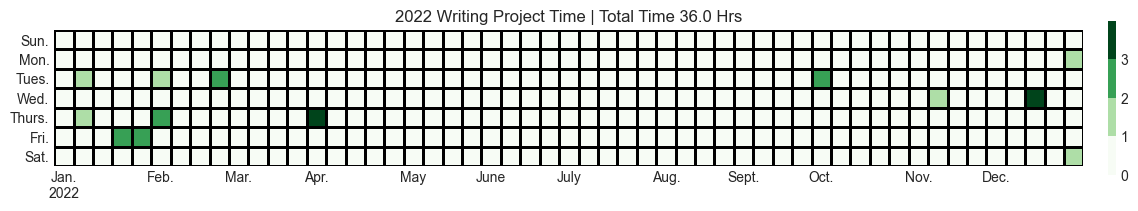
Creative Writing: 208.2 hours
One of my top goals for 2023 was to write and publish more. I published over 20 blogs on a range of topics. Here is a comparison chart:
Here are some of my top writing projects/tasks:
- Journaling: 18:45:00
- Music Production Journey: 11:29:25
- Authenticity Book Reviews: 11:08:56
- Tangible Artistic Creations: 07:40:25
- AI as a Journaling Companion: 07:37:50
It’s notable to me as a writer that several of these posts took over 7 hours each to write. I can’t underestimate that a good piece of writing often times takes days and weeks rather than hours. Unlike music, where the target is 2 to 5 minutes of listening time, good writing takes longer to complete.
I’m glad I was able to carve our dedicated writing time but if I want to hit more writing goals, I’m going to make and put in time on my writing.
[Part 3] Media and Consumption Time
Total YouTube Time: 172 hours and 23 minutes
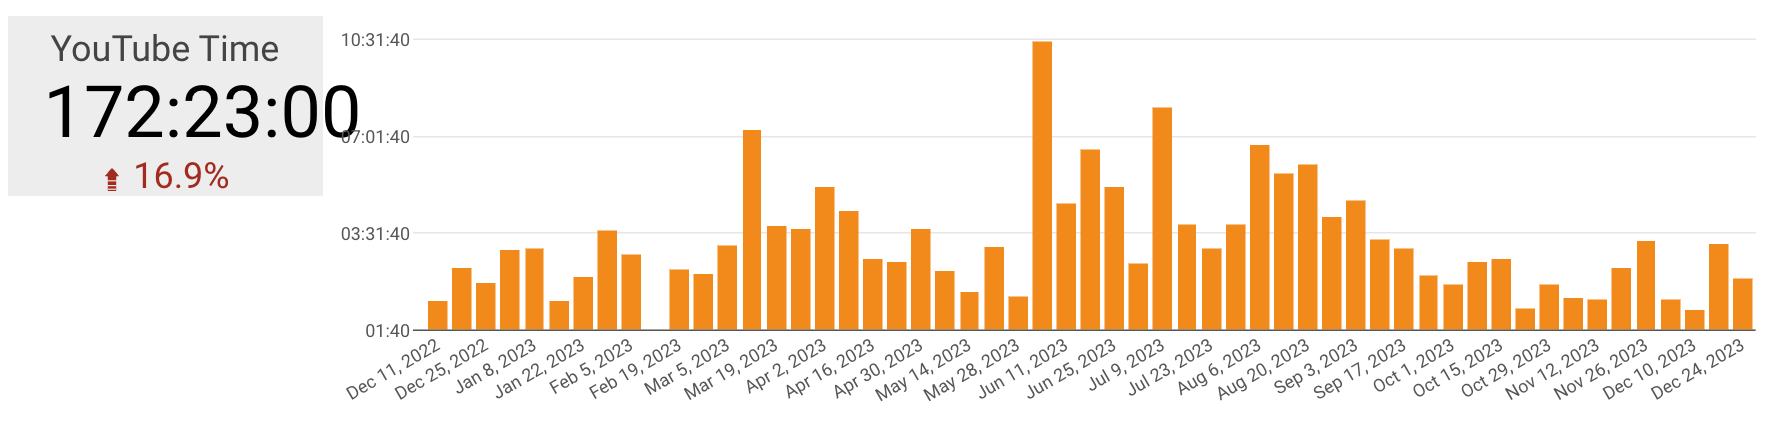
Compared to 2022’s YouTube watch time of 143 hours, I actually increased my YouTube time by nearly 30 hours. In general I use YouTube for entertainment, but there are cases where I use it for learning too. The area I should watch out for are “bing watching” weeks which I can see happened in early June and Mid July.
GAP: Netflix and Movie Watching
I wish I could track my Netflix time. Even though I’m not a heavy TV or movie watcher, one of my biggest time tracking gaps remains tracking my media consumption. For a few years tracked my movies and TV with Trakt. It was unfortunately a manual process. How might I track my TV time in the new year?
[Part 4] Sleep and Exercise
Sleep: 7h27 of sleep per night
According to my actual tracked sleep in Oura, I averaged 7h27 of sleep per night in 2023.
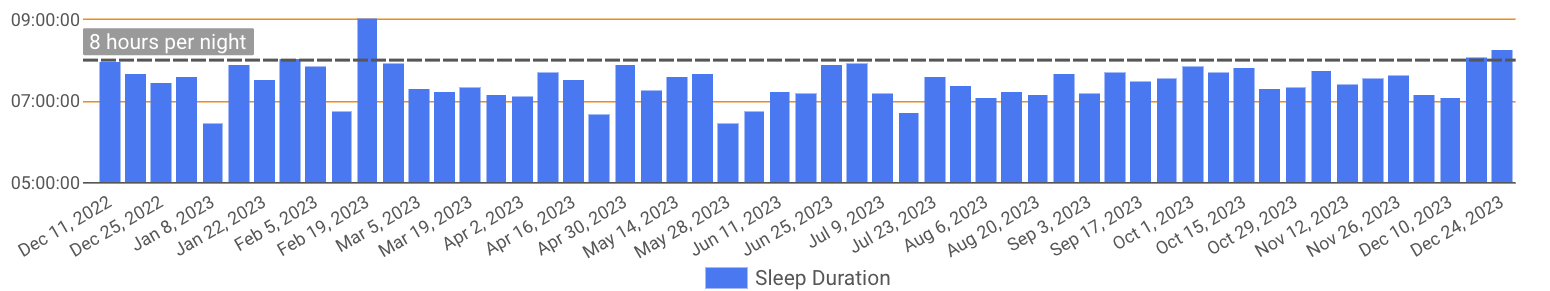
Unfortunately that’s a slight drop compared to 2022’s 7h32 of sleep per night. I’d like to improve my sleep amount and sleep score in the year ahead.
Strava: 608 km of running and 765 km of cycling
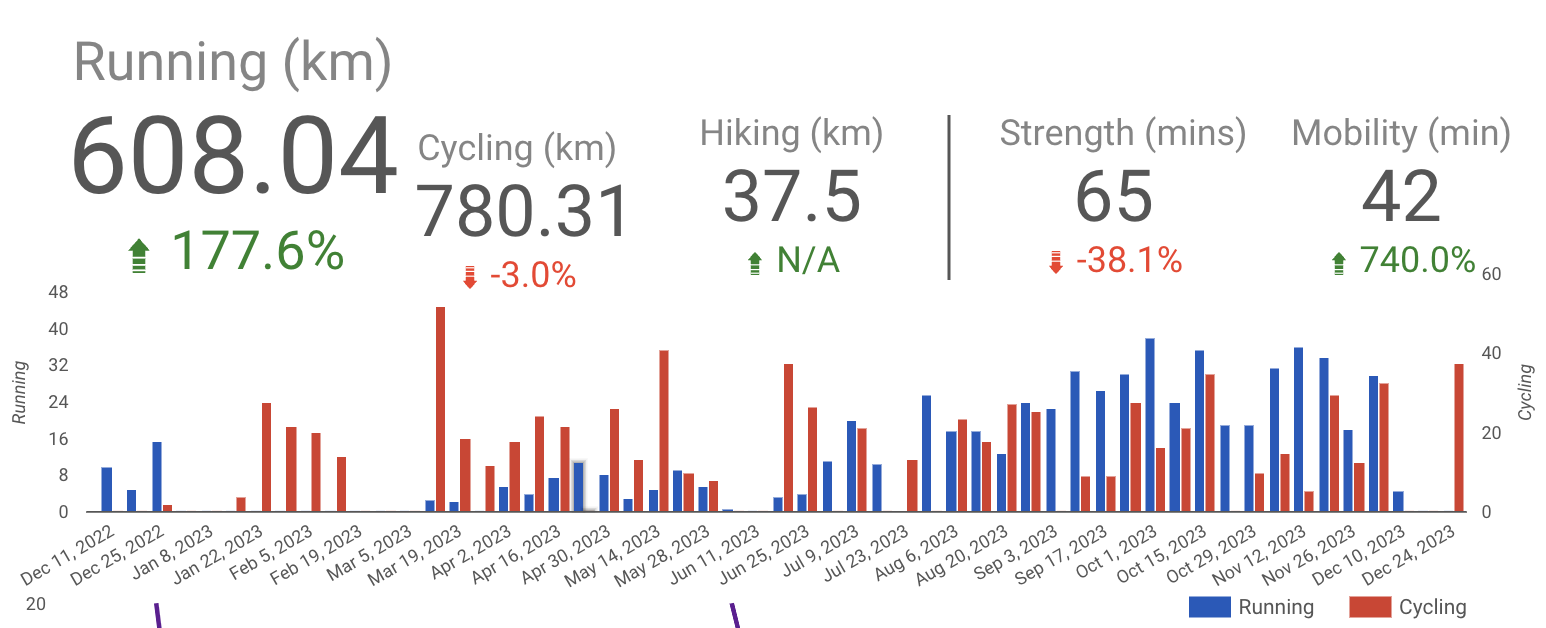
One of my biggest health intentions in 2022 and 2023 was to run more. Unfortunately injuries (sprained ankle and twisted knee) in 2022 limited me. 2023 was a big return. I completed a slow buildup to running again and trained for my first half marathon in a couple years. I completed a 10k under 60 minutes and a half marathon under 2 hours.
Running: 11.7 km per week
- Distance: 608.0621
- time: 63.47 hours
- average: 11.7 km per week
Cycling: 63.7km/month
- Distance 765.16 km
- time 54.28 hours
- average: 14.7km/week or 63.7km/month
By my Strava logs, I spent 117+ hours exercising. This translates to 2.25 hours per week. I’d like to continue this trend in the year ahead: Continue training. Complete another race like a half marathon.
I work for a longevity biotech so I’m keenly aware of my own health risks. Beyond just cardiovascular or heart health, I’d like to increase my muscle mass and improve my strength training. I’d like to add some supplements and consider some advanced anti-aging, health-promoting changes and interventions.
Concluding Thoughts on Year in Time

How you spent your time is how you spend a life. Time management is not just a question of productivity; it’s a question of your life value.
Time tracking remains one of my core behavior habits. By tracking my time, I gain a certain intentionality about how I act in the moment. With my time logs, I can objectively observe where my time goes. With this knowledge I can set realistic and achievable goals.
In last year’s time log reflection, I observed and recognized that my time and focus ebbs and flows in a year with some seasonlity. This is partially a result of actual seasons, like end of year holidays or summer vaction. It’s also based on starting and finish certain projects and goals.
I firmly believe that each of us should strive to understanding and cultivate deep work and flow in our lives. Tangible outputs matter, but the chief currency of our days should focused hours and flow sessions.
I get a lot of flow in my life and work. Good sleep, regular exercise and nutrition all are fundamental. Unfortunately (at least for me) I don’t find flow, purpose or meaning doing the exact same things each and every day. I need a good deal of variety and novelty to stay motivated and drive my creativity. I’m fortunate because my work and creative pursuits have a lot of built-in novelty and unique challenges.
In looking at my data, I see patterns in the time logs that hint at various changes over time. I have come to recognize and embrace the need to transition between different project, goals and focuses throughout the year. I want to stay focused for days and weeks and even months on a larger project or goal, but I need to allocate steps and stages that introduce new challenges, special missions and a sense of achievement in smaller ways. I need to break up my time and set specific challenges that fit the larger vision. In turn, my weekly and monthly goals are best mapped to longer seasons of engagement and towards my epic, challenge goals.
I believe that time tracking has a positive impact on my professional and personal goals. With the detailed tracking of my time across various activities, I can recognize where I am putting in the time for tangible outputs and outcomes as well as where I might be unrealistic in my expectations. For example, assuming I put in 150-200 hours into music production, I can expect to finish and release another 20-40 songs in the next year. I can assume I’ll need to put in more than 200 hours into writing if I wish to write and publish more in the year ahead, let alone pursuing finishing a book.
Regardless of the goal or initiative, time tracking and reviewing my time logs have helped me to prioritize better and see the value of prioritized time and focus. All in all, putting in a good day of work not only gives me a sense of accomplishment but when aligned with most meaningful goals and most appropriate actions can drive real goal achievement. In my case, seeing a good day, week or year’s worth of time and data well-spent is also quite rewarding.
Best wishes and happy time tracking!
Check out other posts, data visualizations and infographics from my year in data.