What would it be like to have greater self-awareness about where our time goes? What would you learn about yourself if you saw how you spent your minutes and hours each and every day? How might you discover and notice “life” if you could see and visualize your actual time input and allotment to your goals and projects in a given year, month or week?
I’m a somewhat obcessive time tracker, and, for several years I’ve been using time tracking to capture where the bulk of my time goes. Initially I was largely fascinated with the technicalities of data capture, i.e. how to track my time in different areas. Over time I’ve come to learn that my time data offers a powerful way to reflect and think about myself, my goals and my life overtime.
Originally tracking my computer usage helped me to monitor my behavior and nudge me towards waste time less. My project time tracking has not only enabled me to bill exactly what portion of my time went to my clients but allowed me to see myself as a function partially of how I spend me time.
By tracking my time I’ve enabled a behavior cue that tends to help through initial procrastination and self-doubt and actually encourages and promotes flow. For example, by actively starting a time tracker I can often induce myself to select what to work on and just start working. Put another way, time tracking leads more conscious time choices and usage in the moment.
Over the years I increasingly have come to see how I spend my time as the key to living life to the fullest, reaching goals and growing. For me time tracking has a marked impact of being present and living and optimizing for flow. Beyond measuring my computer time and my project time, I’ve also incorporated ways to record my sleep, exercise and device time, which gives me a broader snapshot of my energy allotment. As I wrote in a review of one of my favorite books, Four Thousand Weeks, time management is not just a productivity question but an existential, value of life question. Time usage questions should matter to anyone striving to live life to the most meaningfully fullest.
Below are an assortment of data points and charts to help me “score” and data visualize my year in time. While it is interesting to see the high level numbers especially around which projects and goals got what amount of my time, it’s also curious to see the “seasons” of my year through different projects too (more on this in the concluding thought).
Let’s look first at my passive logged device data, before examining my project or focus time. After exploring these charts and any noticed highlights, I’ve included a couple of reflections and “advice” from current self about my past self for my “future selves.” Hopefully by dancing around and in my data I can project the rough outline of my year and years ahead.
Let’s do some data exploration and temporal reflecting!
PS – If you are interested in seeing the evolution of my time logs and time reflections, check out my year in time posts from 2021, 2020, 2019 and 2018. For more on self-tracking and my other year in data art/reflection/tech work, check out my “Track Everything” blog post series.
Part 1: Device Time: Computer, Phone, Tablet
My Total Time: Week by Week
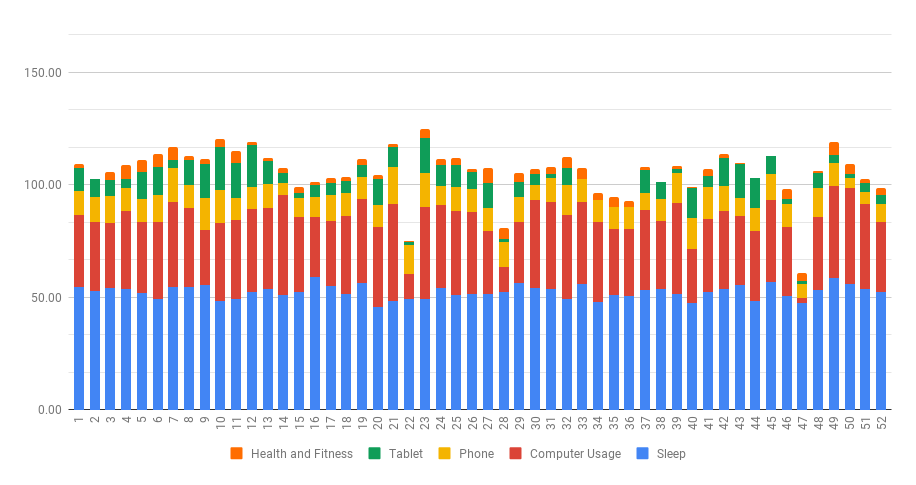
Considering that 8 hours of sleep in a 7 day week equals 56 hours, it’s great to see that my weekly sleep (in blue) was pretty consistently above 50h or above 7h15 per night. In fact, according to my actual sleep tracking log from Oura, I increased my nightly sleep to 7h32 of sleep per night in 2022, compared to 7h22 in 2021. Personally I’d love to see myself avoid the occassional weeks where I drop below 50h since those weeks will likely have a pretty noticeable impact on my cognitive abilities, focus and ultimately creative and learning output.
My Total Screen Time: 2,471.17
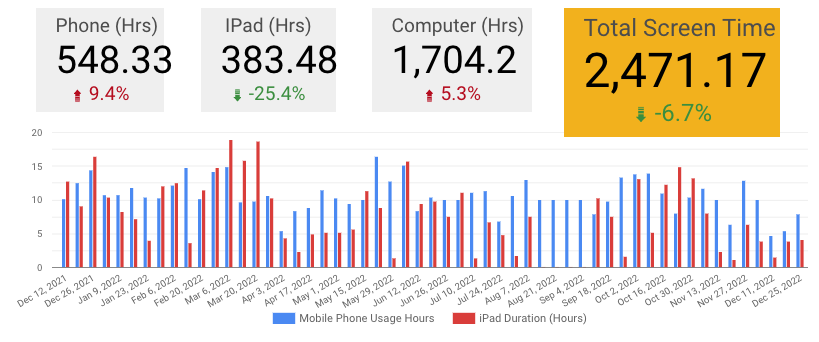
NOTE: This data viz is a snapshot from my weekly review data so the numbers are slightly different.
Interestingly compared with 2021 my screentime dropped by 176 hours in 2022, meaning I spent 4.4 “work” weeks of 40h on smart screens. So even those I spent more time on phone and more on my computer I was less on my tablet.
My Total Computer Time: 1,707.2 hours
According to my RescueTime logs, I had 343 total computer days, i.e. days spent on my computer that were tracked. My Daily Average (of tracked days) was 5 hrs. I had 1,707.2 total computer hours, which was 87 hours more than the previous year (2021).
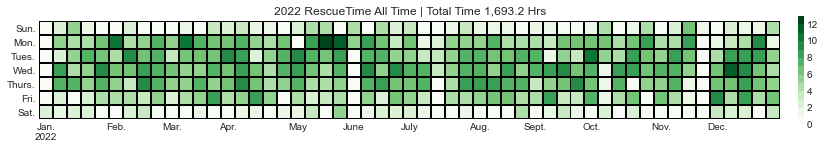
Looking at this heat map, I see that generally Sundays and Saturdays were less computer active. I also see a few week long blocks where I obviously worked much less. Personally I’d like to find more “offline” blocks and weeks and days in year ahead. While it’s great to have such a strong year of work and focus, I think I’m missing out on going offline and giving my computer brain a break.
Most Productive Computer Day = Wednesday’s
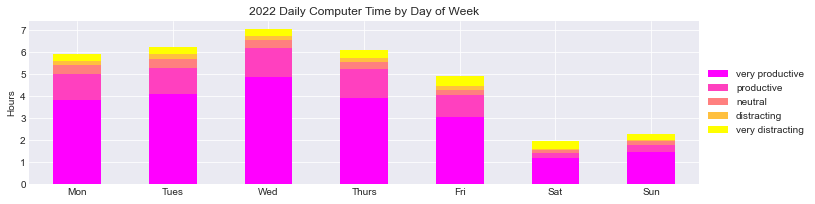
This is a slight shift compared with previous years where Tuesday’s tended to me my most computer active day.
Top Computer Usage Months: August and December
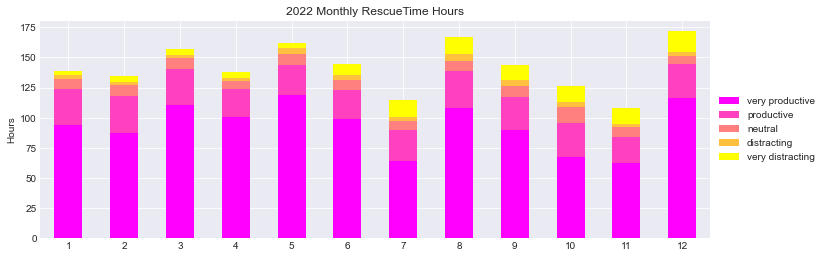
Generally speaking I worked more at my computer than I have in last couple years. August and December showed a pretty noticable increase of my computer time. July and November involved travel and time off, which are reflected in my time logs. Looking forward it could be good to have a stronger indicator of being off, i.e. a bigger drop in some months. Basically if I want to be less computer bound, then my time logs should show this.
Yearly productivity: How does this year compare with past ones?
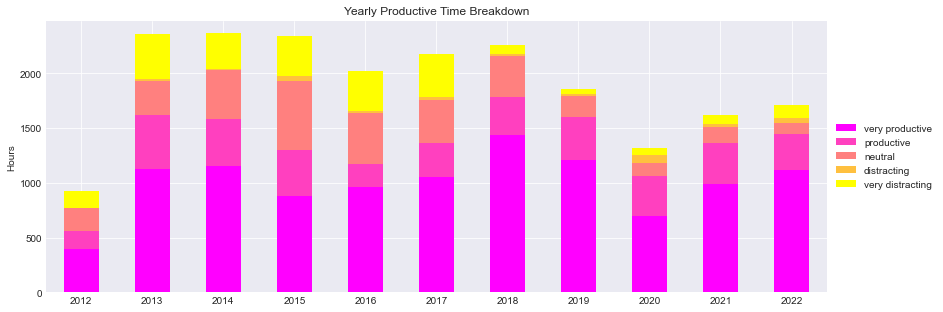
Following drop in computer productive time in 2020 (pandemic anyone?), 2021 and 2021 show an uptick. I’m nowhere near my previous highs in 2013 to 2017 but still an uptick.
Top App Categories = Software Development and Audio Editing
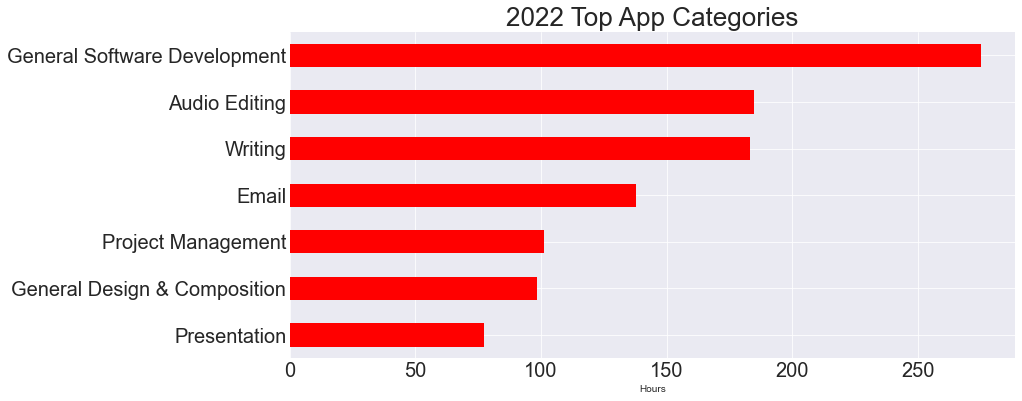
In 2022, my top 7 Categories were:
- 275.1 hrs on General Software Development
- 184.9 hrs on Audio Editing
- 183.1 hrs on Writing
- 137.8 hrs on Email
- 101.1 hrs on Project Management
- 98.6 hrs on General Design & Composition
- 77.2 hrs on Presentation
While 2021 more about design tools like Figma, 2022 was a solid return to software dev, like Drupal development. I still spent a good amount of time designing but it was less centered on exclusively that. Personally I enjoy doing a mix of tasks as a product designer, builder and marketer. In fact, for me a good year might be defined as having opportunities to engage different focuses spanning designing and strategizing and actual building and implementing. While I did spend a lot of time in “writing” tools, as we we will see in a separate data point, I wasn’t doing creative writing. Instead I was using writing tools to take notes and manage projects via writing.
Overall, even though I think project time management is more important than tool time management, seeing what tools, programs and websites I use the most can be a helpful indicator too. Specifically in my case if I want to stay focused broadly across different aspects of products and projects then it can be useful to check on this split more periodically. For example, if I start to feel demotivated or frustrated by lack of progress, checking my tool usage time logs might help me see an opportunity to switch it up.
Part 2: Project Time
For me project time tracking is one of the most beneficial organizational practice I do. Specifically I use a manual time tracking tool called Toggl to track my projects and goals. This manual step of starting and stopping a timer gives me a conscious act where I state to myself, “I will work on X.” Later as I feel my attention waning I’ll check the timer. If I’ve spent at least 45 minutes to an hour on that task or project, it’s most likely a good time for a break.
Let’s take a look at my project time over the last year and see what takeaways I can pull out and potential intentions I can set for the year ahead.
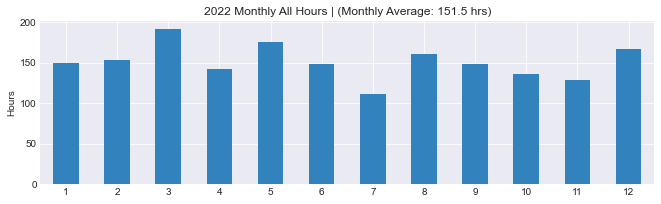
My Project Time: 1818.5 total project hours
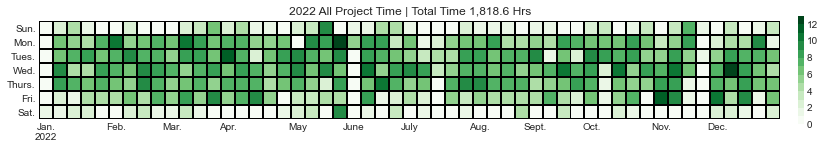
According to my Toggl time logs, I logged 1818 hours on a range of project. Compared to last year I increased my project time by 131.7 hours. Of all the numerical indictors from the last year I’d argue that increasing my project time might be the most exciting and encouraging. I increased my project focus time by nearly 8% year over year. I believe that focused attention on what matters most and has the most impact is one of the most important things you can do to advance on any project or goal. So for me it’s great to see my time allotment matches this desire.
Looking at this heatmap, I see a pretty consistent time input each and every week. This is exactly the kind of “showing up” I hope for myself.
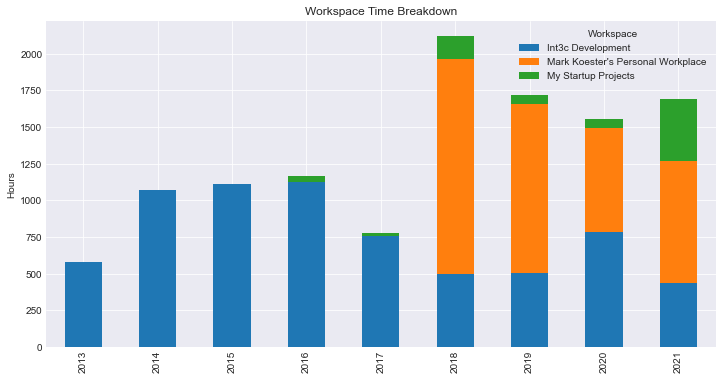
Breakdown Workspaces Time:
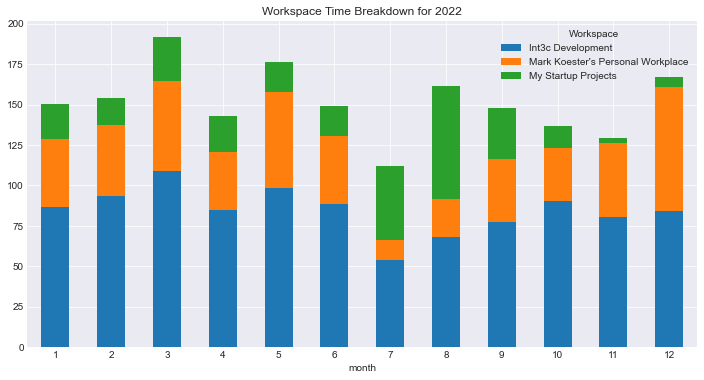
Let’s look at this time in more nuance. While somewhat arbitrary, I divide my time logging and overall work into three broad and somewhat overlapping buckets:
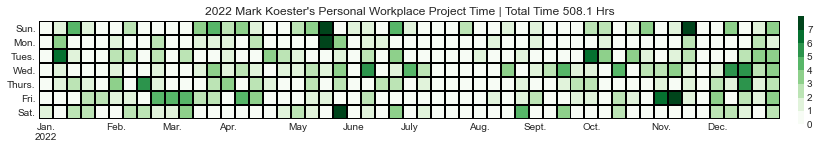
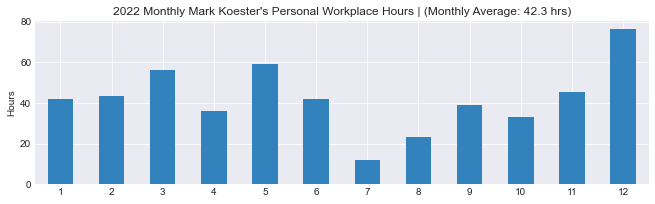
- Personal Workplace includes organizational work, weekly reviews, studies, writing, and music.
- Client Development, Design and Growth Hacking includes paid consulting work as well as some misc work related to that.
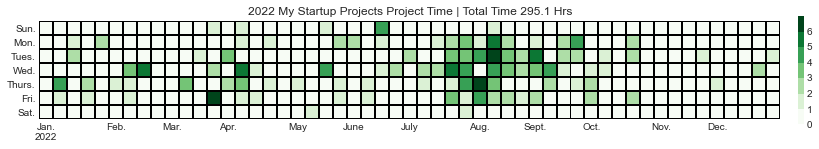
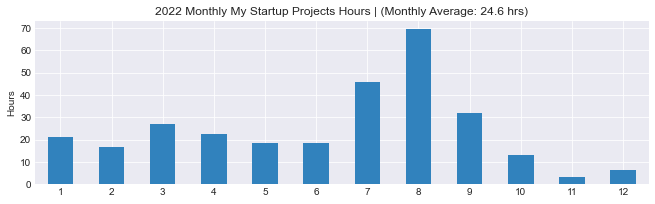
- My Startup Projects includes new projects I build, design and develop as well as some side hustles I operate.
Here is how my project time got split up:
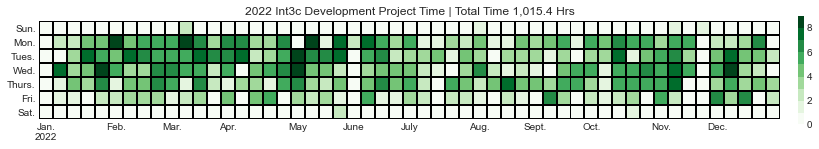
- Client Development, Design and Growth Hacking: 1015.5h
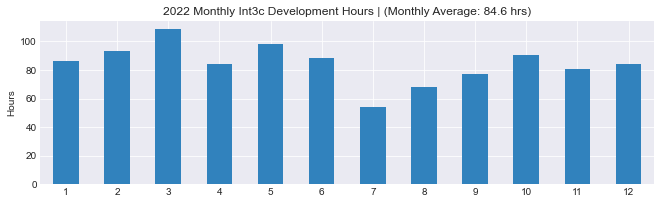
- Personal Workplace: 508h
- My Startup Projects: 295h
On a year basis at my current career stage I’m really happy to see this overall split. I was able to neary 45% of my project focus time on either personal projects or my own startup stuff. At the same time 1000+ hours for client work translates into a healthy financial state too. So, all and all I’m happy.
But how does this translate into the general ebb and flow of my last year?
Breakdown of My General Time Allotment:
Client Consulting: Design, Development and Growth Marketing
Personal Projects, Writing, Music Production and Studies
Startup Projects:
Monthly Trends: Breakdown of Workspaces:
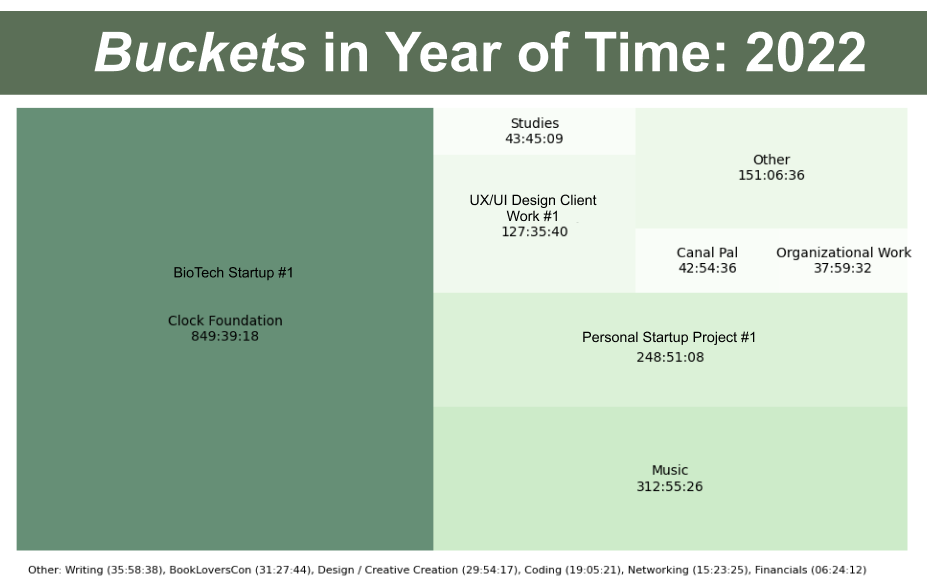
The Big Blocks of My Project Time

Overall, I’m very content with where my time went last year. I put in focus and flow time into a wide range of projects, skills and goals. I made measurable and meaningful “output” progress largely, I believe, due to my regular time put in and flow.
Arguably, if time is a big way to define our existential value, the most important questions each of us should be able to answer about a day, a week or a year are: 1.) Where did my time go? (Epistemolical) and 2.) Is that what I wanted or intended? (Normative)
Looking at my data, I can tell you that these were the three leading “time takers” last year:
- BioTech Startup: 849.5h
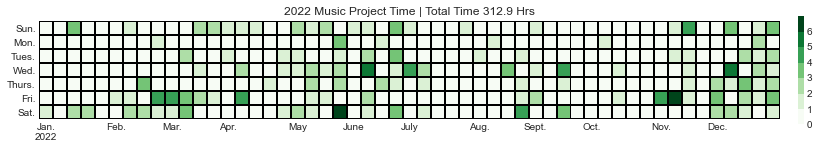
- Music Production: 313h
- My Side Startup Project: 249h
Roughly speaking each of these projects was tied to one of the individual workspaces. So by finding time for each project I found time for one of my key workspaces.
Considering that each of these projects made notable progress and had meaningful achievements, I think my time input was well-aligned. Obviously the more time you put in something doesn’t necessarily mean you’ll always get a greater output. In my case with music I managed to release one album. For the biotech I designed our health reports, developed several sites and products and delviered several marketing traction funnels. For my own startup I built an early prototype we’ve been testing with partners and early users.
Beyond these core three projects I am happy to report the time put in other areas translated to meaningful progress too. Obviously there is never enough time but fortunately I found some time and did my best to maximize what I could to move things forward and get decent ROIs.
Music Learning, Production and Creation Time: 312.9 hours
Total YouTube Time: 143 hours
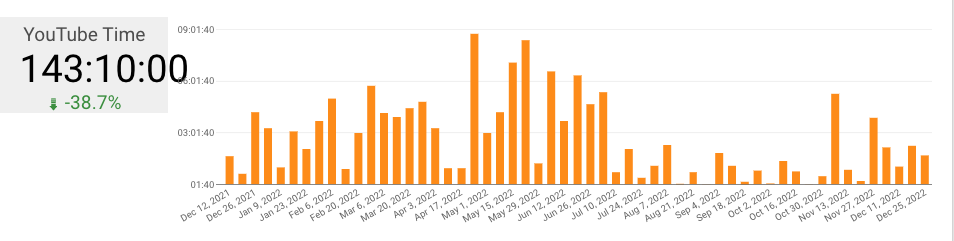
Historically, YouTube has been one of my bigger time sucks. I’ve largely avoided all-night YouTube binges and instead use it more strategically for tutorials and learning. Looking at my year of YouTube watching it’s interesting to see such a significant drop from late summer into fall. Looking at other data this is also when I increased my time spent reading, which is a great time usage swap.
How much time was capture? How much is unknown?
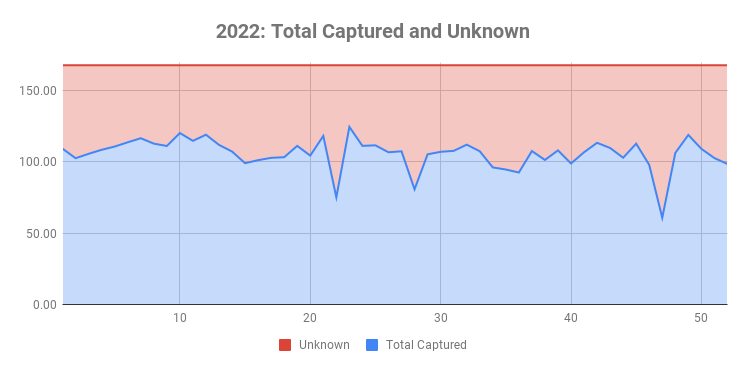
Each week is 168 hours so I like this chart since it shows that in fact I’m tracking nearly 60 or 70% my time in some capacity.
While in all seriousness I doubt I’d want to track all of my time, having a solid baseline tracking my attention time or tracking my flow through my projects and computer usage is empowering towards greater self-awareness and ultimately making better choices towards my goals and what I care about.
While much of my work around time tracking and time reflection have been on the technical aspects of data capture, looking at this known/unknown time chart hints at an aspiration I have for sometime around triggering reflection opportunities. Specifically, when my time deviates from normals or when there are outliers, how might I enable and trigger moments to reflect? What might I learn from a call out periodically based on my time usage? This is a data-driven form of self-reflection many of us, myself included, could benefit from. A chance to think twice.
Concluding Thoughts on Year in Time: Find Flow, Embrace Seasonality and Be Open to Elasticity
All in all a great year in time. Lots of time went spent and flow-inducing doings. I’m grateful for my health, positive work situations and supportive relationships. All of this contributes in small and big ways to the time I have in this life.
Stepping back what else do I see in my time data logs?
Interestingly this year when looking at some of the charts above and thinking about my year through data, I noticed a lot up’s and down’s. While I try to imagine myself in terms of consistently showing up and regularlity (an ideal I aspire to), what I noticed instead was something I’ve never really “seen” before, at least from a week to week basis, namely seasonlity. In fact, my kind of focus and flow centered way of working and creating appears to look more seasonal than I previously thought.
We might might call these the “seasons” of my work and focus life. In my goal focuses and time allotment, there are observable periods where I was pulled into different goals and focuses.
Many of us might want to control and dicatate a year as a monolith or single thing/focus. Each year in our goal setting, we want to set a plan for the year with a certain predictable and ordered pattern of habits and doings. We imagine ourselves like computers where we just need to get the get the “code” right and life will play forward consistently. I’m personally a huge believer in building and maintaining good habits as well as framing my life through dependable routines. These do matter but there should be room for flexibility or even elasticity on where our time, focus and flow goes.
In looking at my data, I find my time logs indicate more subtle changes over time than I had noticed before. While it might viewed as a flaw in my ability to be consistent, in fact, I’d argue that it is good (at least for me) to transition between different project, goals and focuses throughout the year. In my case this ability to spend dedicated time in different areas brings me a lot of interesting benefits personally and professionally. These seasons of engagement give me unique opportunities to grow and change. When I leave a project for awhile I sometimes feel guilty, but the reality is that this might be point of maintaining a longer-term creative and evolving life.
While I think flow or focusing on hard things in a singular way is essential, it might not always been possible to find flow in the same activities day in day in and day out. We should all strive to find flow daily but maybe not always in the same doings. We sometimes need to take a break from a project or particular skill and try new things regularly. Utilizing different skills in different projects might work better. Adding new challenges helps us grow. Accepting life as seasonal rather than singular might be a better mindset too.
Best wishes and happy time tracking!
Check out other posts, data visualizations and infographics from my year in data.