
This data was logged with RescueTime and Toggl. Data collection and visualization powered by QS Ledger. This post is part of my 2019 Year in Data project.
Highlights:
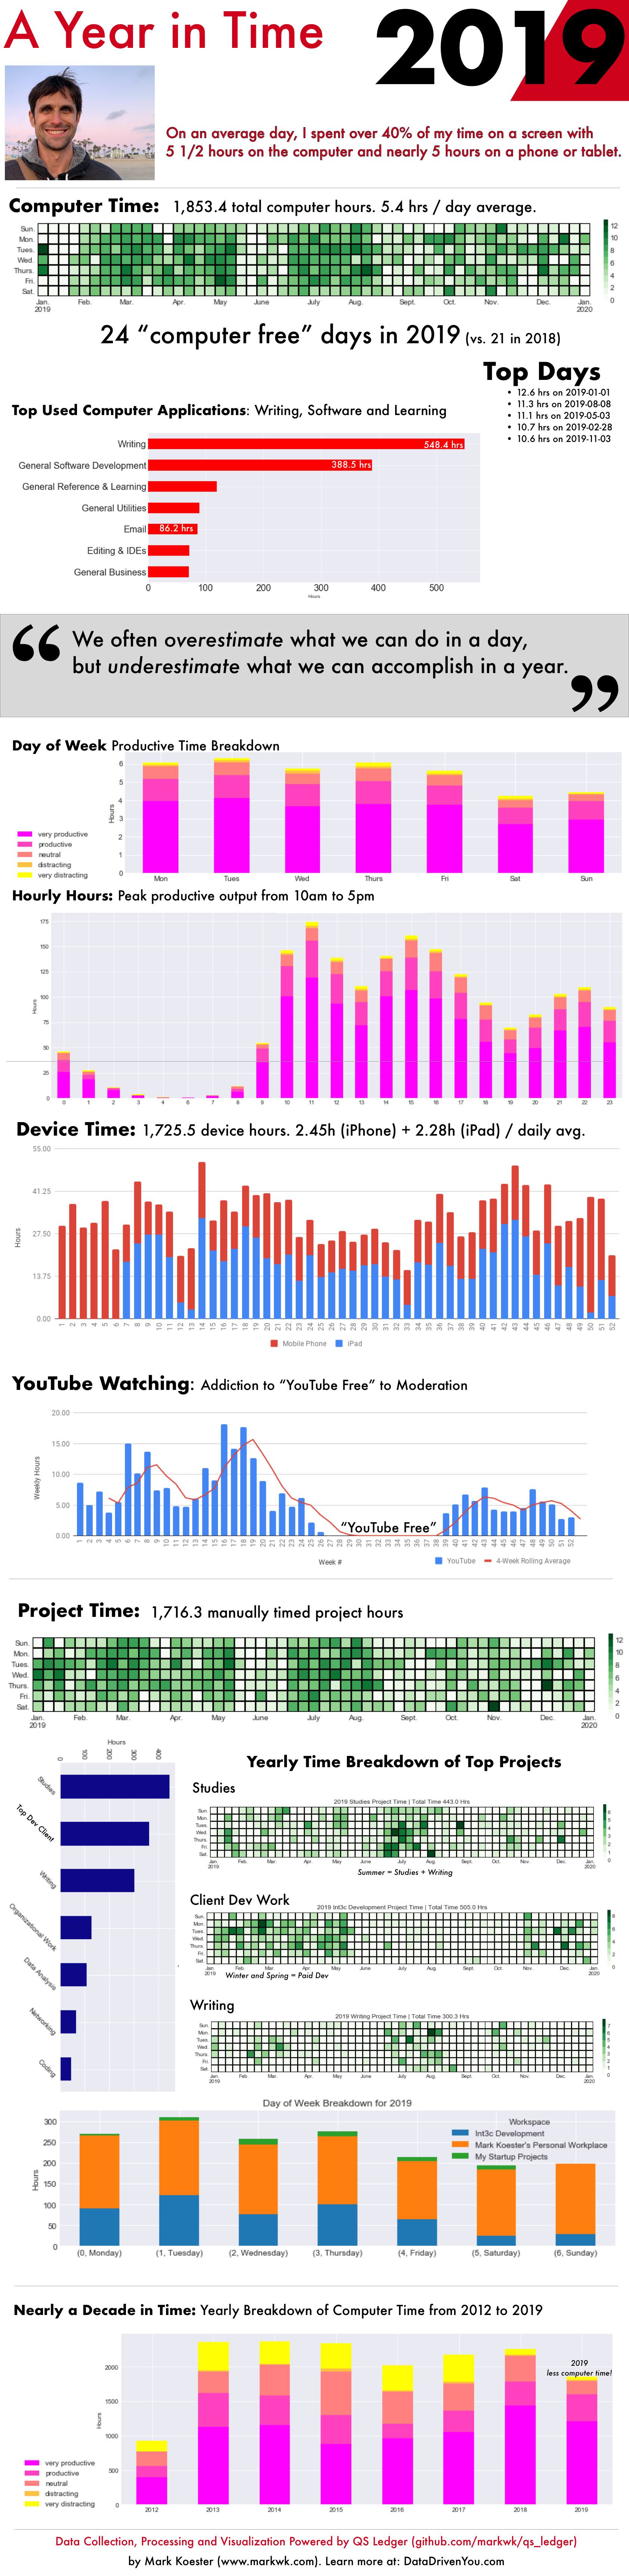
While I spent less time on my computer in 2019, I still spend a lot of time computing with several days where I spent 10+ hours. Overall, I still have gained a lot more balance in how much time I spend on the computer compared to previous years. I’m happy that I don’t spend the majority of my computer time on email and instead most of my time is on writing, note-taking and software development. It’s also great that I maintain a consistent ratio of computer time to project time, which basically means that when I’m on the computer, I’m working on a project or goal. Sadly, I still spend a lot of time on non-computer devices.
How I Tracked It:
I continue to track my time primarily using two tools, RescueTime and Toggl. Toggl lets me record my project time and it’s a conscious way to notice what I’m working on. RescueTime is an entirely passive way to track your computer usage. Interestingly, I’ve used both of these tools since 2013 and this was the source of one of my early year in data visualizations, How I Tracked a Year in Time and What It Meant. For device and screentime tracking, I use Apple’s Screentime and simply log this weekly into a spreadsheet. This provides a pretty easy way to see my evolving device usage over time.
What I Learned:
Besides increasing the number of “computer free” days, the two biggest lessons from looking at my time tracking from this last year were:
- Mobile Phone and Tablet “Addiction”: Like most everyone I struggle with my screetime, meaning my phone and tablet usage. Digital wellness is something we all need to grapple with. While improvements have been made, I still feel like now and this past year I spend far too much time on my phone. This is partially because I’m a mobile app developer, but it’s also because I still have plenty of time sucks on my phone. Even though I don’t use Facebook, Twitter or Instagram, I have things that pull me into a lot of screen time. For me the two biggest time sucks on Netflix and YouTube, both of which I use on my phone or tablet. This year I did a 30-Day “No YouTube” Challenge that helped me gain perspective and decrease my usage (at least for awhile). One idea would be to get more aggressive with using Airplane mode or Disabling Notifications during certain hours.
- My Evolving Obsessions: As a product manager and entrepreneur for the last decade, I’ve tended to work in cycles across the year. One or two projects will pull at my attention and I’ll put in considerable time and tasks on that for awhile until once completed or as new opportunities shift my focus, I’ve vaguely known this for year, but my time logs and visualizations have made these patterns more clear. It’s interesting to see in the heatmaps how visiable certain evolving obcessions become over days and weeks. For example, we see client dev work clustering in the beginning and end of the year, while my studies and writing had a strong push over the summer. This pattern is also repeated in my task logs (see below).
Looking Ahead:
While I wish I followed a single schedule year round, I doubt this will ever happen. This is just the nature of my work and how much of the consulting and startup space operates. I need to continue to embrace a certain core of routines and habits, namely around time management and morning routine. I need to ensure I read, study and write consistently (over less productive phone and tablet use). Having blocks in my schedule for writing or code studies makes it clear to me what matters.
Overall, I will continue to work in batches with targetted outcomes on client projects, personal goals and new products. Basically it’s about developing organizational processes and a schedule so I do the fundamentals (writings, running, etc.) and finding daily blocks to pursue deep work and cultivate flow.
Check out other posts, data visualizations and infographics from my year in data!