
This data was logged with Todoist and my simple goal scoring system. Data collection and visualization powered by QS Ledger. This post is part of my 2019 Year in Data project.
How I Tracked It:
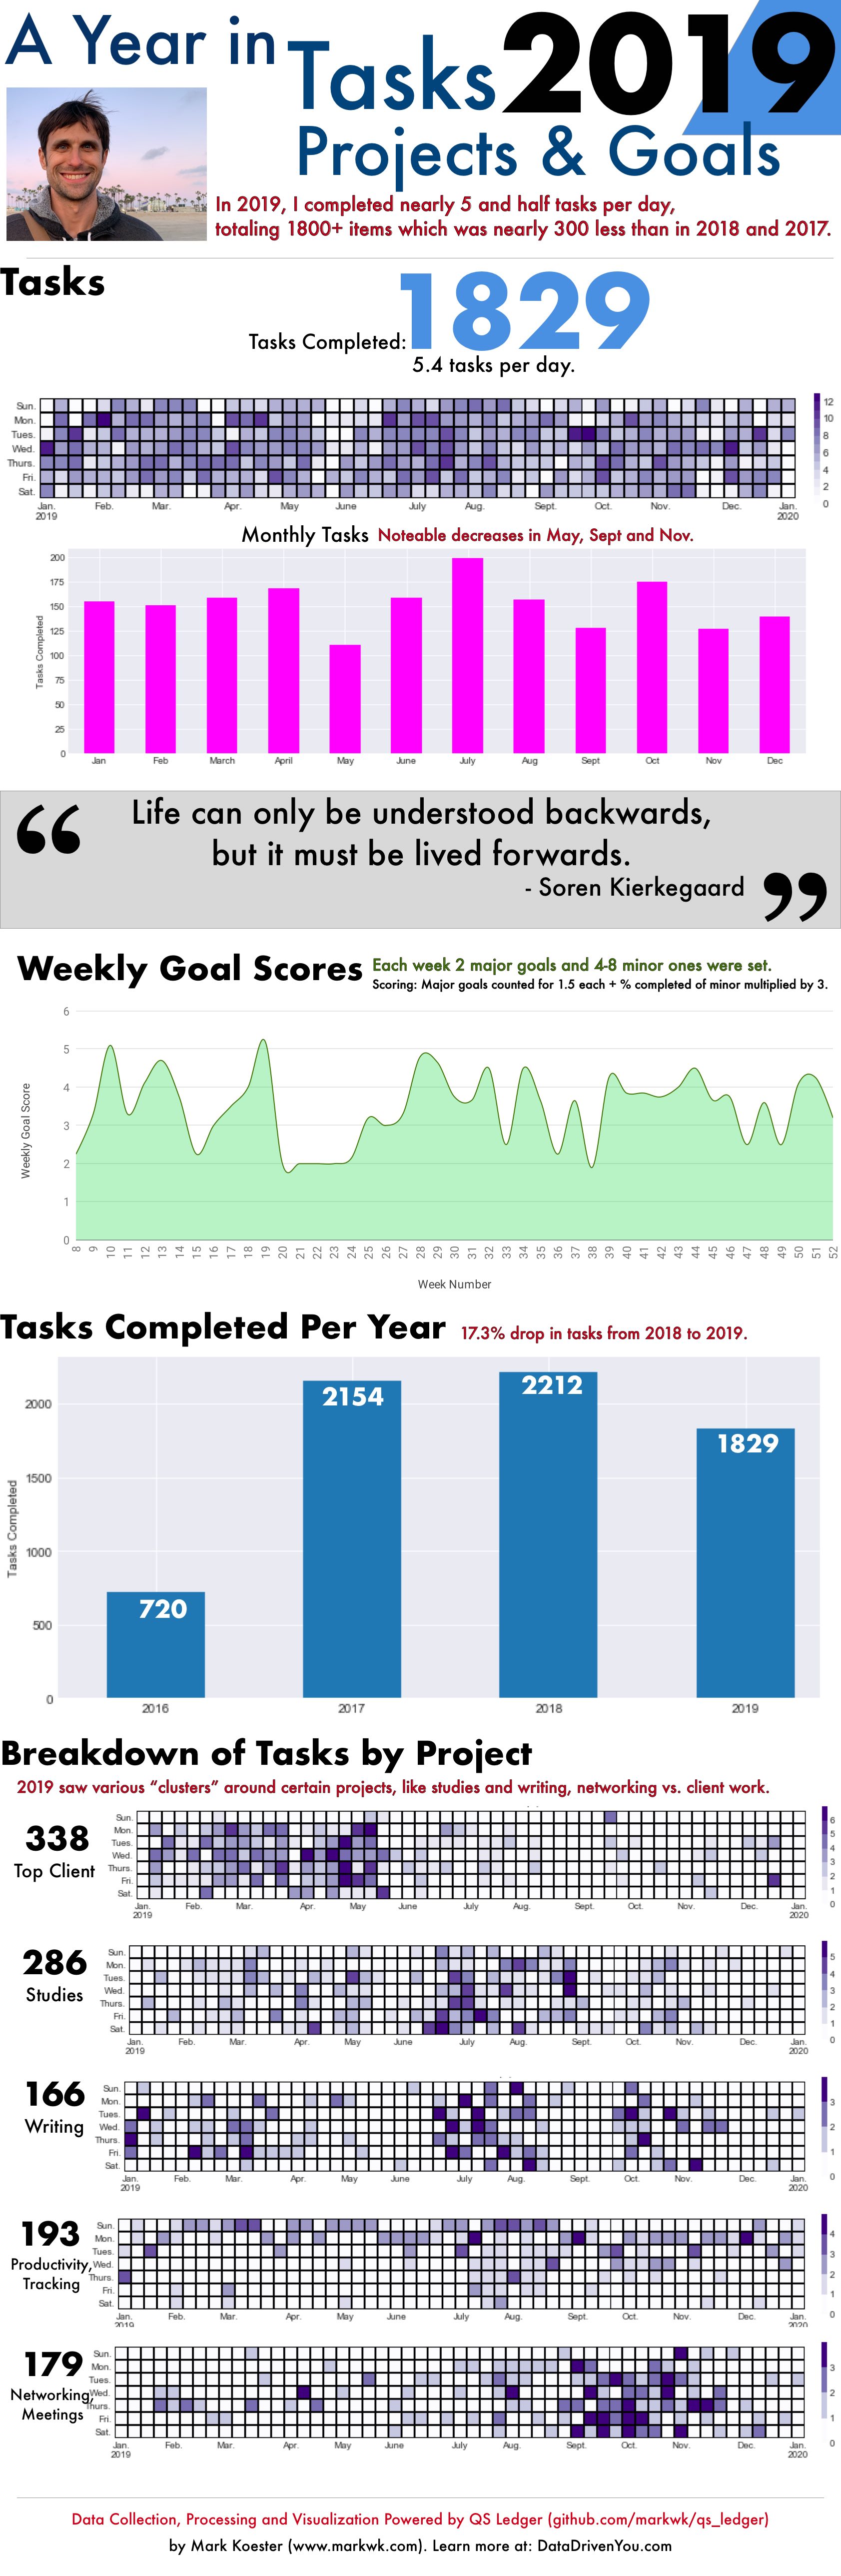
- Task Tracking: As I wrote about in Tracking Your Tasks with Todoist, I use Todoist as my task management tool. I’ve used various apps, including Evernote for a few years until I migrated off of Evernote a year ago. Todoist helps me to manage my upcoming actionable items for work and personal projects. Todoist is a well-designed product that is built in the spirit of Getting Things Done. I’m a fan of how I can assign Todo items in my calendar from Todoist. When it comes to data collection, their API is great but you can also use IFTTT and create a recipe so all of your completed tasks are saved into a Google Spreadsheet.
- Goal Scoring: One new addition this year was Goal Scores, which I wrote about in Scoring Your Weekly Goals. The basic idea is each week I set one or two major objectives and a few minor ones. For me, I score major goals as worth 1.5 each, and minor objectives are scored by percentage completed multipled by 3. So the max score would be 6. I find this to be a solid way to make weekly progress and track that progress in a relatively objective way. My goal scores showed a significant drop in May when I was on a work holiday in the US.
Highlights:
I got a lot accomplished in 2019 in terms of tasks and personal goals. Unfortunately, a couple months of travel and my move to Los Angeles both contributed to a less stable work and life situation. The uncertainty and stress of moving meant I got less tasks done at several stages of the year. Setting up my personal and professional life in a new place also meant I spent a lot more time on networking and meetings, which the data clearly shows. I had a high concentration on networking from Sept to mid-November. This came through a combination of a job hunt and looking for new clients. Like my time logs, there are several noteable patterns, namely we see consistent organizational work on each and nearly every Sunday or Monday when I do my weekly review.
What I Learned:
Before doing this year in data, I largely would have thought I spent roughly the same amount of time and completed roughly the same number of tasks in 2019 as 2018. Our retrospective memory struggles to estimate such large expanses of time. It’s possible that the productive end of the year biased me to think I was more productive across the year. My actual data showed this wasn’t the case. My completed tasks was less than last two years. I still largely completed all of my major yearly goals, but I didn’t check off as many things from my todo lists over time.
Looking Ahead:
Looking at my task data makes me think that 2019 was a somewhat inconsistent year in terms of my productivity. In view of the fact that I traveled more and moved countries, this shouldn’t have been such a surprise. I was still getting a minimum amount done, but it was less than in previous years.
So my main takeaway looking forward is to ensure greater consistency in my working pursuits. I need to strive at sticking to a schedule where I get both minor and major tasks completed each and every day. Personally I’ve found Weekly Goals and Goal Scoring to be a simple and powerful way to get key things done (and also track it). I find that I can use my yearly and monthly goals to align weekly objectives so I do more work that aligns with my passions and long-term objectives. In the year ahead, I’d like to avoid low productivity days.
Check out other posts, data visualizations and infographics from my year in data!