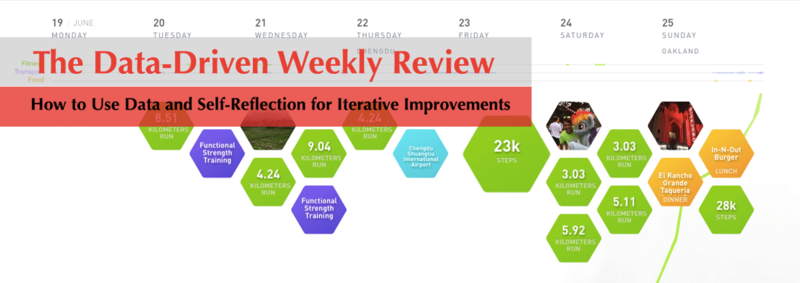
Weekly Review 2.0: Of all my habits and routines, writing a weekly review is one of my favorite and most productively beneficial.
A “Weekly Review” is a period of time you set aside each week to pause and take a higher level look at your projects and tasks. In contrast to your doing and working mode, a weekly review is a reflective one. It’s about checking-in on how things are going, dealing with the mess, organizing it all and planning the future.
Each week I set aside about 30 minutes to take a step back. I see how things went during the previous 7 days. I pull out some key data points and write down my key takeaways. Then I set some objectives and mental visualizations for the week to come. Great weeks and shitty weeks happen, but the war is often won in finding consistency in your forward momentum. This is the power of the weekly review.
As I’ve become more and more focused on self-tracking and data collection, my weekly reviews have become increasingly data-driven.
In this post, we are going to look at the basics of what is a weekly review and using your tracking data to improve how you can do your weekly review. The goal is to make your weekly reviews data-driven. I’ll share my simple recipe using Google Form, Google Sheets, Zapier and Evernote to collect and log your data, to calculate and compare your trends and, finally, to generate a weekly review template for high-quality reflection and writing.
What is a Weekly Review?

I originally got the idea of doing a Weekly Review for Paul Allen’s book “Getting Things Done” (GTD). GTD is a productivity philosophy focused on helping you deal with the madness of too much information and too many potential things to do. The main focus of the methodology developing a well-defined process for managing all of your tasks and information. Along with this process, the book also recommends doing a weekly review. This means taking time each week, outside of doing and working, to organize and reflect on your working process.
I’ve been doing Weekly Reviews since early 2013. The format and questions of my original weekly review have evolved over the years, but a few parts have consistently remained the same:
- First, I do it each and every week. For me, I do my Weekly Review every Sunday. It’s good to pick a date and time you can do this each week.
- Second, I remain committed to trying to limit my weekly review to around 30 minutes. It’s easy to keep adding additional questions, reflections and data points, but I believe it’s best to keep it short and focused on your most important areas.
- Third, my weekly review continues to be based on both reviewing the past 7 days and reflecting on the week to come. This looking back and looking forward is the main objective of my weekly review.
At its most basic, the power of the weekly review is taking time to examine your weekly accomplishments (and failures), record your analysis in writing, and visualize and plan for the week to come. It’s simple but extremely powerful.
Here are a few prompts I use and have used:
- Thoughts for the last week
- Thoughts for the week to come
- Things to Remember from the Past Week (Example, picture or sentence or two)
- What was one thing or achievement I’m proud of from the past week?
- What’s one area I’ve struggled with this past week?
- What’s something I’m working on?
These are just a few ideas. You should mix and match the best prompts for you and the goals of your weekly review. My only advice is to keep it short (both in time you use to complete it and time frame you are examining) and actionable (i.e. what you can do rather than general undefined vibes).
Overall, a weekly review is a brief span of time where you reflect on the past week and organize your thoughts, tasks and priorities for the week to come. You might end your weekly review by setting 2-5 weekly objectives for the next week too.
What is a “Data-Driven” Weekly Review?
Now that we’ve covered the basics of the weekly review as a tool for staying organized and for building reflective optimizations, I’d like to share how my weekly review has incorporated my tracking data. Over the past couple years, I’ve increasingly leveraged tracking and self-testing. I use it to help me improve different aspects of my my life, including my productivity, health, personal goals, fitness and more.
The benefit of bringing data into a weekly review is you remove a certain degree of mental bias. Instead of being biased by the last couple days (good or bad) or even the fun things from Friday and Saturday, I get a more comprehensive picture of my past week. The Data Doesn’t Lie!
During my weekly review, I am able to pull out specific numbers on aspects of my life. From tasks completed and computing time to sleep and exercise, my weekly review has a few clear points of reference, which I use to compare this week and past weeks.
For example, I pull in how many miles or kilometers I ran in the past week and compare with the previous week to see if I’m training to improve my volume and hitting minimal goals. I look at how many tasks I completed and whether it’s an improvement or decrease from the previous period. I can even see how much time I spent on my computer and how productive my time online was.
Before I start writing and reflecting on the past week, I employ these data points to get an objective measurement on the past week. By pulling this data into your weekly review, it’s a lot easier to see how things are going and what you might need to do to keep improving.
Let’s look at my “tech” recipe for creating your own Data-Driven Weekly Review.
How to Create a Data-Driven Weekly Review
By using a collection of free, web tools, it’s easy to create your own data-driven weekly review.
Here are the five steps to creating your own data-driven weekly review:
- COLLECT various data points from your tracked life
- LOG your data points via Google Form
- CALCULATE and COMPARE your data using Google Sheets
- GENERATE your Data-Driven Weekly Review Template into Evernote (or your preferred service) using Zapier
- REFLECT and WRITE on your past week and week to come using data and your weekly review prompts
In this section, we will look at how to use Google Forms for flexible data logging, Google Sheets for storage, data cleanup and comparison, and Zapier to post your Data-Driven Weekly Review Template to your preferred service, like Evernote or even email.
COLLECT: Your Tracked Data
![]()
Before you can make your weekly review data-driven, you need to start tracking.
There are hundreds of things you can track in your life. From health and fitness to productivity and media consumption, there are fewer and fewer areas of our lives that can’t be tracked. In my series “Track Everything,” we’ve looked at: step counters, weight, hydration, iPhone usage, book reading, music listening, tasks, movie and TV watching, habits, podcasts, article reading, meditation, sleep, time, computer usage, and workouts among others. If you are interested in tracking any of these specific areas, I recommend you check out those individual posts. You can also look into Life Logging which will let you log any and all.
If you are looking for my recommendations for baseline tracking, see: “How to Track a Life: Ultimate Guide of Tools, Apps and Techniques for Self-Tracking,” where I go into some of the best tools and techniques for personal data collection.
A lot of people (myself included) start tracking things without any specific reason or application. They count their steps or log their heart rate. A few weeks or months later, when their device breaks, they don’t see any benefits or changes and stop logging.
Unfortunately the failure isn’t in the tracking but in the application of that tracking into some meaningful discovery or change. While it’s fun to track random stuff for awhile, ultimately tracking should the first step in a process towards self-improvement.
When it comes to collecting data for your weekly review, I recommend coming up with a few data points that fall into specific categories of your life, like health/fitness, productivity, and goals and achievements. Feel free to include your own categories. For example, if you are working on a goal like run a marathon or complete your novel, then find a way to track your progress towards that goal.
As they saying goes, you can’t manage what you don’t measure.
Once you have a few categories in mind, it’s time to pull out relevant data from your tracking. So, for health and fitness, you’ll want to pull out things like how far you ran (or cycled) in a week, how much time you spent doing yoga, or how many steps you took. For productivity, you will want to note how long you spent on your computer, how many sales calls you made, your productivity score or how many tasks your completed. For goals and achievements, you can note how many times you did a certain activity, how much time you spent on a target habit or goal (like writing, coding studies, etc.).
Avoid data overkill by pulling in too many data points. Try to come up with one or two valuable data points for each of these key areas in your life. Start tracking them regularly and each week pull out those data points.
LOG: Using Google Forms to Store Your Data
While tools like Gyroscope, RescueTime and other tools let you see your weekly aggregate numbers, there are a lot of data points that are still not all integrated into those tools. Also most simple data analysis starts with a spreadsheet.
So, it makes a lot of sense to initially log your weekly data points yourself. Fortunately Google Forms makes this process simple.
It’s only three steps: First, go to Google Forms and create a new form. Second, you’ll want to add a few default fields like Week Number and Date. Third, you’ll want to create questions and fields for logging the key data points you are tracking.
Here is an example from my form:
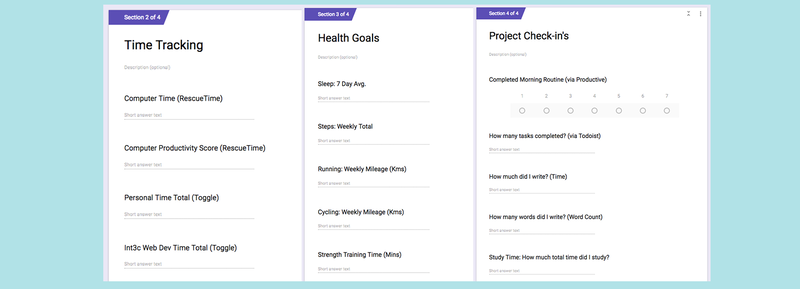
Once you’ve setup your Google Form, each weekly review should start by you logging your tracked data to this form directly.
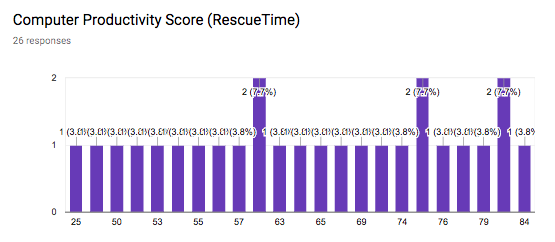
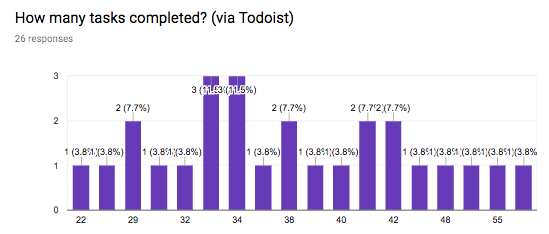
While the majority of our data analysis will be done using Google Sheets, Google Form provides some simple charts and graphs in the response area. You can use this periodically to check on your general trends.
Here are two examples:
There are a lot of options for collecting this kind of info. You can use a physical notebook or even log it directly into Google Sheets. The benefit of Google Forms is its easy, flexible and directly integrated into Google Sheets.
Let’s look at how to do a bit of data cleanup and create some week-on-week comparisons.
CALCULATE** and **COMPARE** your weekly data using Google Sheets
The next step is cleaning up the data logged and then calculating and comparing changes from week to week. You can technically use any spreadsheet application to accomplish this. One good alternative is AirTable. The great thing about Google Forms is that it puts all of your responses into a single row on a spreadsheet in Google Sheets. This data is also easily integrated into other services like Zapier, which we will look at later.
Here is an example of the raw data from Google Form into Sheets:
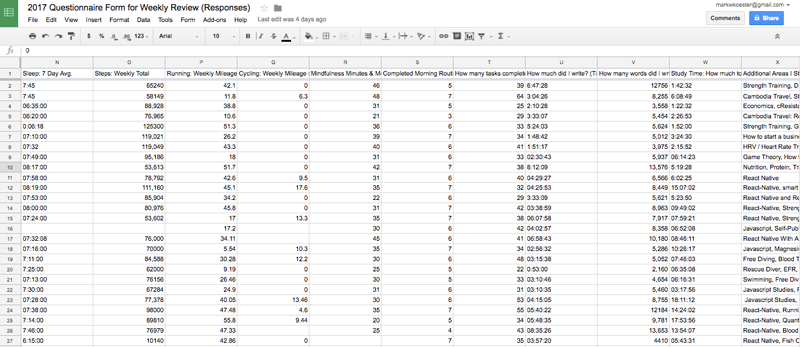
Depending on the data points you are logging, you may not need to do much data cleanup. Personally I log a few time variables in a format that don’t work perfectly in Google Sheets, so I need to edit 4 or 5 fields to remove an apostrophe.
I then copy the latest response row and add it as a new row in the aggregate sheet. Then, I use a few calculations to create useful numbers (i.e. durations into minutes) and them compare with the previous week. Let’s look at a few examples.
Number Comparisons: Comparing number fields like steps is simple. You just need to subtract this week’s value from the last week’s. For example, here is one formula: =H27-H26. H Column is where I log the number of tasks I completed from Todoist. This formula simply sees if I did more or less tasks from the past week.
In order to translate this into something meaningful for my weekly review template, I add an additional column for comparison and use this formula: =IF(AJ27 > 0, “⇧ Tasks Completed”,”⇩ Tasks Completed”). This formula says: IF the calculated variable is above zero, then I completed more tasks this week than the week before. Otherwise I did less tasks.
In my generated weekly review template, I include a line that looks like this: Tasks Completed (Todoist): 35. -8 ⇩ Tasks Completed this week than last week.
Time variables: I do two things on duration fields. First, I convert the duration into minutes and then calculate the weekly difference. Second, I run a IF formula to see what the change represents.
Here is an example from my RescueTime Logs: =(G272460)-(G262460). I convert the duration format HH:mm:ss (4:10:00 or 10:45:24) using the a formula to translate the duration into a minutes: original value X 24 X 60. In this case, G27 is this week’s time variable that we multiple by 24 hours and 60 minutes to get the total minutes. We then compare this with last week’s number (G27) to get the difference.
I then use this formula: =IF(AD27 > 0, “More Computer Time”,”Less Computer Time”). This formula says: IF the calculated variable is above zero, then I spent more time than last week on my computer. Otherwise I spent less time on my computer.
I can use these two calculated fields to add a line in my weekly review template like this: Computer time: 52:56:00. More Computer Time this past week than last by 186 minutes.
I use these calculations and comparisons on a few different duration fields. For example, I log my manual tracked time from Toggl and run similar comparison calculations on my project time, writing time and study time. I log my sleep time to determine if I sleep more or less this week than last.

Additional Considerations: Hopefully you can see from these two examples how to create useful comparisons with your logged data. In general you should already have an idea if your data is good or bad, but having these comparisons provides a better way to track trends.
Using google sheets you can create all kinds of calculations and comparisons. Depending on what your focus is, it’s a good idea to create weekly comparisons so you can know if you are tending positively or negatively towards your goals.
Let’s turn now to how we can use this data to generate our weekly review template.
GENERATE a Data-Driven Weekly Review Template using Zapier
To pull all of this together we are going to use Zapier. Zapier is an automation app that links different services together. So, for example, if you log a run in RunKeeper, Zapier can pull your run stats and post a social media message or log it to a spreadsheet. With over 700 web services, there are thousands upon thousands of ways to use Zapier to automate your life and work.
In this section, we are going to use Zapier to pull together all of the pieces of our tracking and logging and create a data-driven weekly review template in Evernote.
Ultimately the goal of a weekly review is focus on reflection of the past week and visualizations and planning for the week to come. Many folks skip the data logging and simply pull out a notebook and spend an hour answering some questions and writing. This is a good method too, but it’s even more empowering when you have tracked data points to fuel your writing.
Fortunately, now that we’ve logged our tracked data into Google Sheets using Google Forms and done some simple calculations and comparisons, we can generate our data-driven weekly review template using Zapier.
Zapier is quite similar to another automation service IFTTT, which also links different services together. Zapier is much more robust in how it can be customized to manipulate data and take defined actions. A full walkthrough on Zapier goes beyond this post. If you have never used Zapier, I recommend reading Zapier’s Getting Start Guide.
To create our data-driven weekly review, we are going to be linking two services: Google Sheets and Evernote. Zapier will periodically check for a new row in our Weekly Review Google Sheet and then trigger an action to then create a weekly review template using all the data we logged.
Here is a basic overview of this recipe or, as Zapier calls them, a “Zap”:
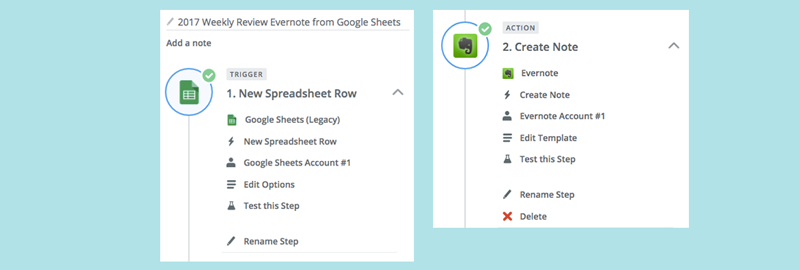
After creating an account and logging onto Zapier, click the “Make a Zap” to get started. You first need to search for the Trigger App, which in this case is Google Sheets. Zapier may ask you to verify this integration. You then need to select the Google Sheets Trigger for “New Spreadsheet Row.”
You’ll then to enter in the name of the Spreadsheet and Sheet Page:
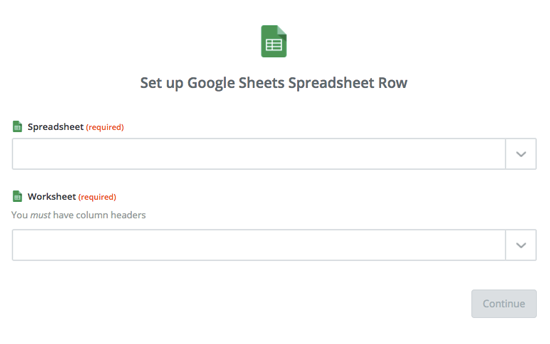
Once configured, continue forward. Zapier will pull in a sample of data from the spreadsheet you specified.
Next you’ll be adding an “Action Service,” which is the response Zapier will take to the Trigger. There are hundreds of actions Zapier can take. In our case, we want to post our data into the notebook application, Evernote. You could also post to Google Docs, OneNote, Hackpad or even send yourself an email.
After selecting “Evernote,” you want to use the action “Create a Note” and link it to your Evernote account. This might also required a step to confirm this integration.
Now it’s time to work on our template. You’ll want to hardcore values for which notebook you want this stored in as well as include a title. Every field can include variables from Google Sheet you linked to.

From this example, you can see I’ve created a custom, unique note title that pulls in the dates for the first and last days of that week, and I also include the Week Number.
To add variables, you click the + PLUS button on the right where you can scroll through and add any info available in your google spreadsheet:
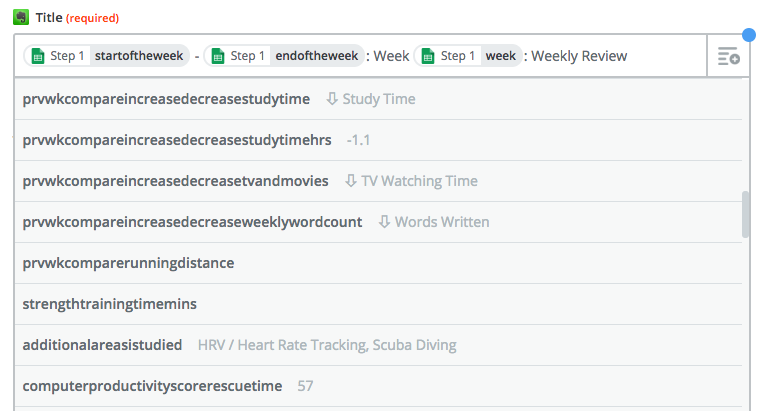
The next area to customize is the note’s content. This step can take some time depending on how you want to customize your template and number of variables you add.
At the top of my note I include my two main questions:
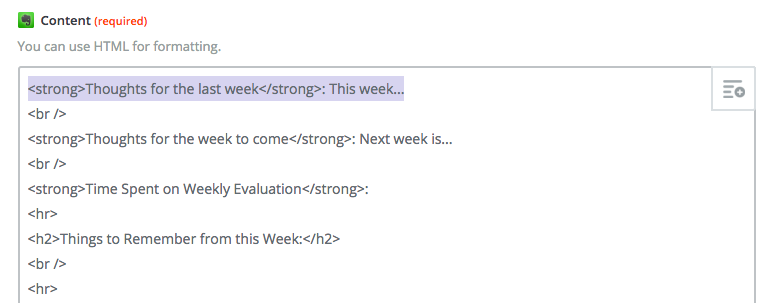
As you can see, Zapier lets you use HTML tags to customize the styles.
For the core areas you are focused on, I recommend including a section for each. In my case, I have a section for time tracking, health and fitness, project check-in’s, and creativity.
Here’s what my time tracking section looks like in Zapier (on the left) and the generated note in Evernote (on the right):
![]()
As you can see from this example, I also included a screenshot from RescueTime in my weekly review. I add this in manually during my writing step. Screenshots are an easy way to make your review review more visual and provide more data too.
Here is what my health and fitness section looks like in Zapier (on the left) and the generated note in Evernote (on the right):

I again included a screen sheet which I pull from SportTracks which is where all my running workouts get aggregated.
Once you’ve finished customizing your template, click “Continue” and Save on the bottom of page. Follow the final steps, including testing and naming your Zap. Enable your Zap.
Now each time you add a new row to your weekly data collection, Zapier will create your weekly review template, customized to your needs. Test this out by submitting a new form entry. (NOTE: This might take a few minutes to trigger. You can also manually trigger this trigger check.)
As we’ve seen, Zapier makes it easy to pull data from one source and post it into something else. In our case, we are using our weekly data to create a data-driven weekly review.
In the end, it’s up to you how you want your weekly review to look and which data points to include. Zapier can be a bit tricky to use initially, but if you make small tweaks each week, it won’t be long until you have a exactly what you need: a powerful and custom, data-driven weekly review template.
REFLECT and WRITE Your Data-Driven Weekly Review
From collecting and logging your tracking to data comparisons and generating your template, all of these previous steps are in the service of one goal: helping you reflect and write your weekly review.
Ultimately, the point of a weekly review is help you see trends and make choices to make improvements.
To accomplish this, you don’t even necessarily need to track or use the digital tools like we have looked at. What you need to do is take some quiet time to reflect and write.
Personally I find data and tracking to be a powerful aid in helping me think about my life and projects. While there are periods where I have spent quite a lot of time to track things, I largely use passive tracking services to collect the data I can use. This data lets me go beyond my mood and have an objective view on what I am doing.
I’ve also slowly refined which data points and tracking provide the most benefit and focused on using those in my weekly review. You can’t literately “track everything” in a useful way. While you can track many things, it’s best to focus on a few that are meaningful, instead of attempting to bring all of your data into your weekly reflection. Otherwise you risk spending much more time on data collection over reflection.
Use data to add to your reflection. But don’t fall victim to spending more than 10-20 minutes pulling in that data. Instead, focus on using a few tracking data points.
Conclusion: The Data-Driven Weekly Review or How to Use Data and Self-Reflection for Iterative Improvements
In this post, we’ve built a data-driven weekly review. I provided a recipe of techniques and tools to create your own data-driven weekly review. A weekly review is a bit of time each week to reflect and write on past few days and week to come. By using Google Forms, we can log anything we track. By leveraging Google Sheets, we were able to do some data cleanup and create weekly comparisons. Finally with Zapier, we were able to pull all of this together to create a starting template, which we posted to Evernote, for completing your weekly review.
Personally one of my most favorite habits and practices is my weekly review. I’ve completed over 200 weekly reviews to date, and while I rarely re-read them (except at the end of the year), they provide an on-going momentum for working and living smart, happy and organized. Each week’s 30 minutes helps me keep a clean mind, recall what went well and organize for what’s to come.
A weekly review won’t miraculously change your life nor make you more productive, rich, heathy and happy. That requires a broader level of self-development, including good habits and smart choices. What a Weekly Review can help you do is make self-improvement iterative. You start to build up a series of small improvements that add up to bigger life changes.
I think data and tracking can helpful in this process, especially when used in a “data-driven” way. For me data-driven is the effort to use research, science and personal tracking and testing to help you make better choices and build positive habits. Like building habits, you should focus on it until it is automatic and then forget about it.
Your data-driven weekly review is your weekly check-up to see what’s working and what’s not. While you might do this with a coach, colleague or boss, the main person you need to do this with is yourself.
Take ownership of your life, data and trends by setting aside 30 minutes or so each week to collect some data, log it and write your data-driven weekly review.
Good luck and happy tracking!
