
“I just wish I had more time” Everyone
Arguably, time management is all life is. Oliver Burkeman in Four Thousand Weeks: Time Management for Mortal
Each year we can look back on our year in different ways. We might remember a few highlights, like trips, acheivements and memories that stand out. We can look at new things we’ve got or special experiences we had. But what about where our time goes?
Most people can only vaguely wonder about how much time they spent in a past year. Obviously most of us “know” we spent a lot of time on our work and we can guess at the large amount of time on our phone, gaming and/or social media. But what about a specific number? What about actually knowing where one’s time goes?
For myself and other self-trackers and quantified self enthusiasts, who track their time, the end of each year, week or even a single day comes with a precise, data-driven way of knowing where our time goes.
In my case, in 2021, I spent 1687 hours on projects and 2647 hours on my devices (1619h on my computer, 501h on my phone and 514h on my tablet). I’d also estimate I spent over 250 hours on kindle reading.
Below are a bunch of data points and charts that breakdown where my time went in different ways and provides some ways to visualize my time. After looking at some of these charts and key highlights, I’ve included a couple of reflections and “advice.” I’ve broadly divided this into two main parts: Device Time and Project Time.
NOTE: This post is part of my 2021 Year in Data project with data logged using RescueTime, Toggl and my iOS’s screentime feature and visualized using Quantified Self Ledger.
Part 1: Device Time: Computer, Phone, Tablet
My Total Time: Week by Week
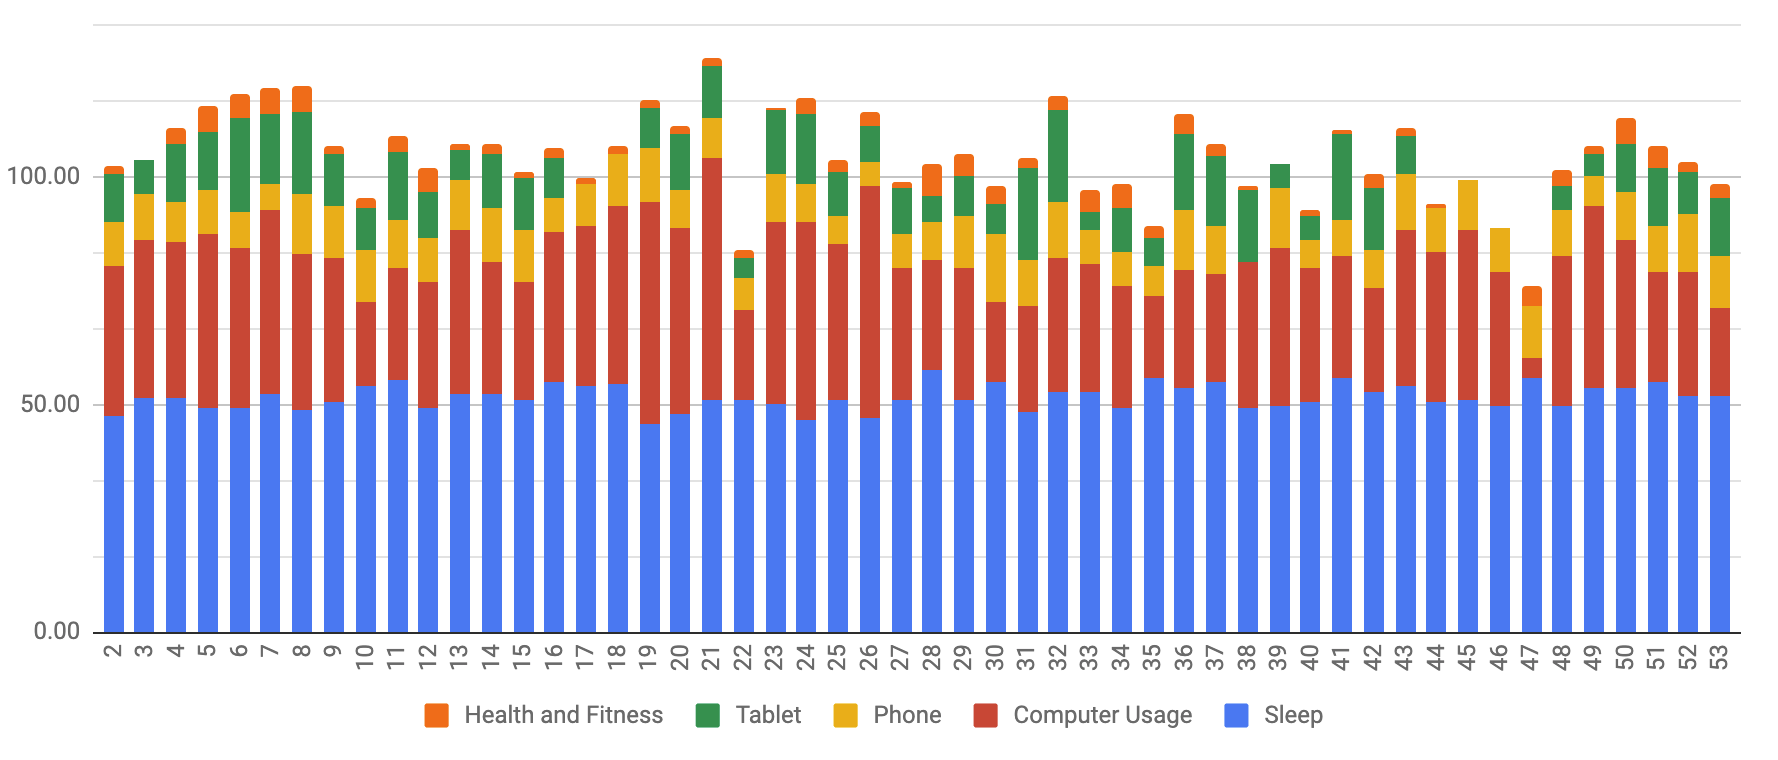
Considering that 8 hours of sleep in a 7 day week equals 56 hours, it’s great to see that my weekly sleep (in blue) was pretty consistently above 50h or about 7h15 per night. Historically I’ve gotten myself pretty burned out by not sleeping enough so this data is a good confirmation of sleeping and sleep hygeine.
My Total Screen Time: 2647 hours
It’s interesting that I decreased both my phone and tablet time but due to increase in computer time, I saw a pretty notable overall increase of 10%. Here is personal device time usage:
- Phone: 501h (24.6% decrease)
- Tablet: 514.38 (3% decrease)
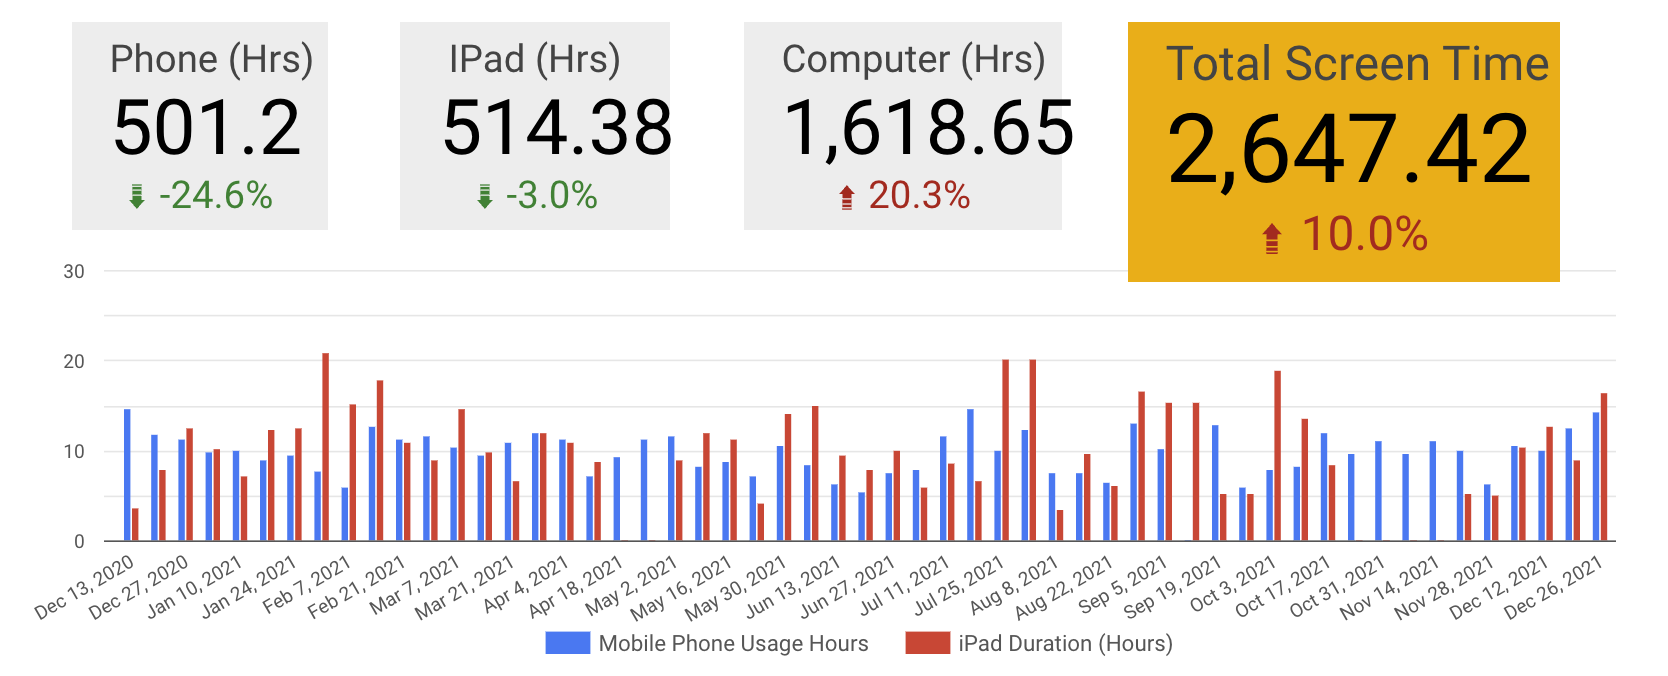
NOTE: This data viz is a snapshot from my weekly review data so the numbers are slightly different.
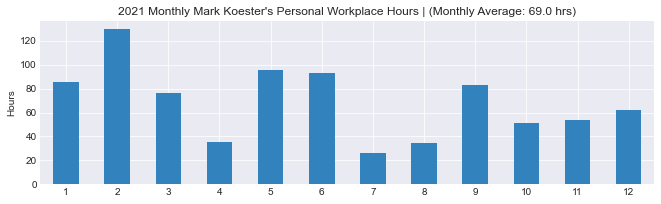
My Total Computer Time: 1619 hours
According to my RescueTime logs, I had 341 total computer days. I spent 1,620.2 total computer hours. My Daily Average (of tracked days) was 4.8 hrs.
Here are a few data snapshots:
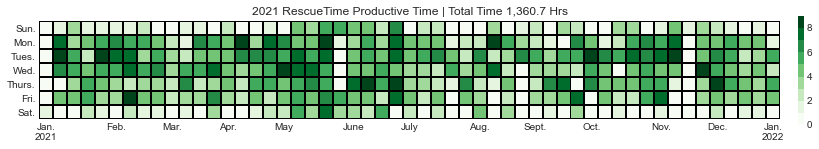
It’s interesting to see the white boxes where I spent much less time on my computer compared to the darker greens where I spent more. If I had better data viz skills, it would be cool to add some kind of marker that represented the main activity or project.
I’m happy to again see that I am not getting sucked into communication tools like email and slack nor meetings like Zoom and Google Meets. Instead, the bulk of my computer activity usage was on design, writing, audio tools and software development.
Most Productive Computer Day = Tuesday’s
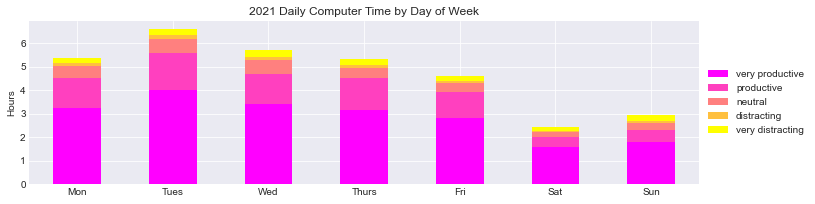
Top Computer Usage Months: May and June
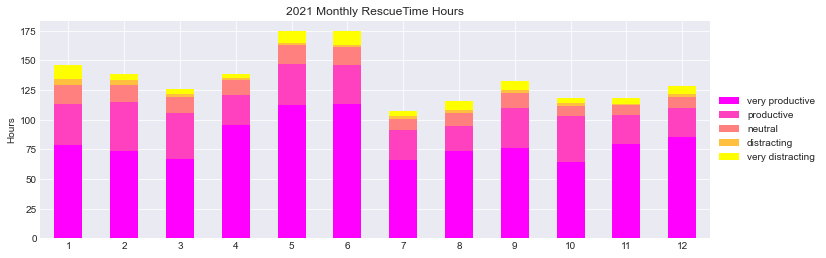
The obvious question for these two months: What was taking my attention and time then?
Yearly productivity: How does this year compare with past ones?
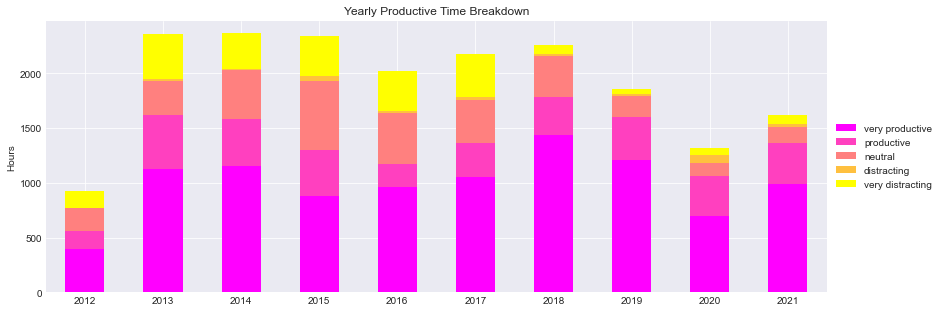
2021 (like 2020) represents a decrease in overall computer time. This is likely an overarching trend in how I think about my computer and work time. Behaviorially, I have gotten better about ending my day at around 5pm everyday for exercise and movement. Unless there is a fire to put out, I respect my end of day breaktime. I also have largely stopped letting my evenings get pulled into client and startup work now.
Top App = Writing
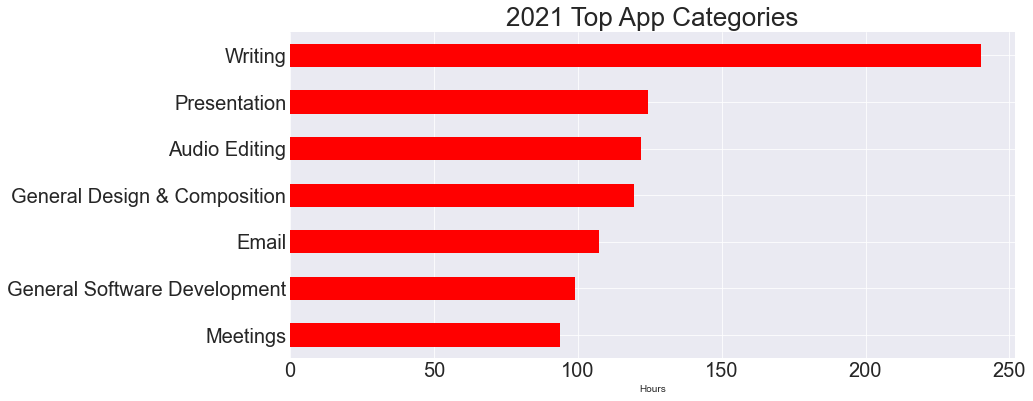
Considering I had focused a lot of 2021 researching and writing a book, it’s great to see I was putting time on writing-related tools.
Here are the exact numbers on my top 7 categories:
- 240.0 hrs on Writing
- 124.6 hrs on Presentation
- 122.0 hrs on Audio Editing
- 119.5 hrs on General Design & Composition
- 107.4 hrs on Email
- 99.0 hrs on General Software Development
- 93.7 hrs on Meetings
It’s curious that so much of time was spent on presentations. This likely represents both actual presentations as well as a general practice of logging growth and marketing updates in Google Slides.
Considering 2021 was a big learning year for me and music production, it’s awesome to see I was 120+ hours in audio editing tools, like Ableton Live. Unless you are putting in the time, you can’t expect to make progress and reach goals.
Peak Computer Usage around 10am to 12 pm
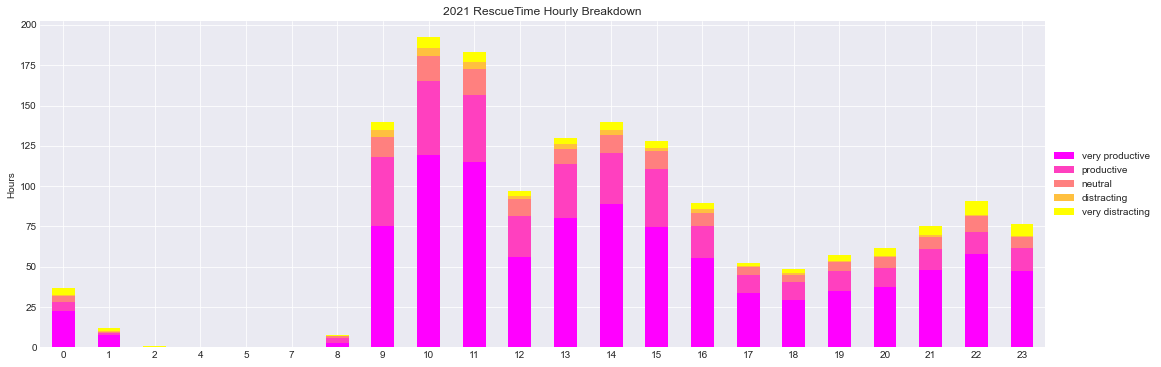
Like previous years, my computer usage tends to peak from 9:30 until noon. The pinks and fushia colors mean I was largely productive then.
Part 2: Project Time
While automatically tracking tools like RescueTime and device screentime make it possible to track your device usage passively, they unfortunately can’t tell you the projects you were working on. In order to know what you are consciously doing and focusing on, you need to track it manually somehow. In my case I use Toggl when I start and stop work on basically any project. This gives me a pretty amazing record of where my project time goes. Personally I think project time is one of the most important things to track, know and reflect on if you want to pursue self-aware and impactful productivity.
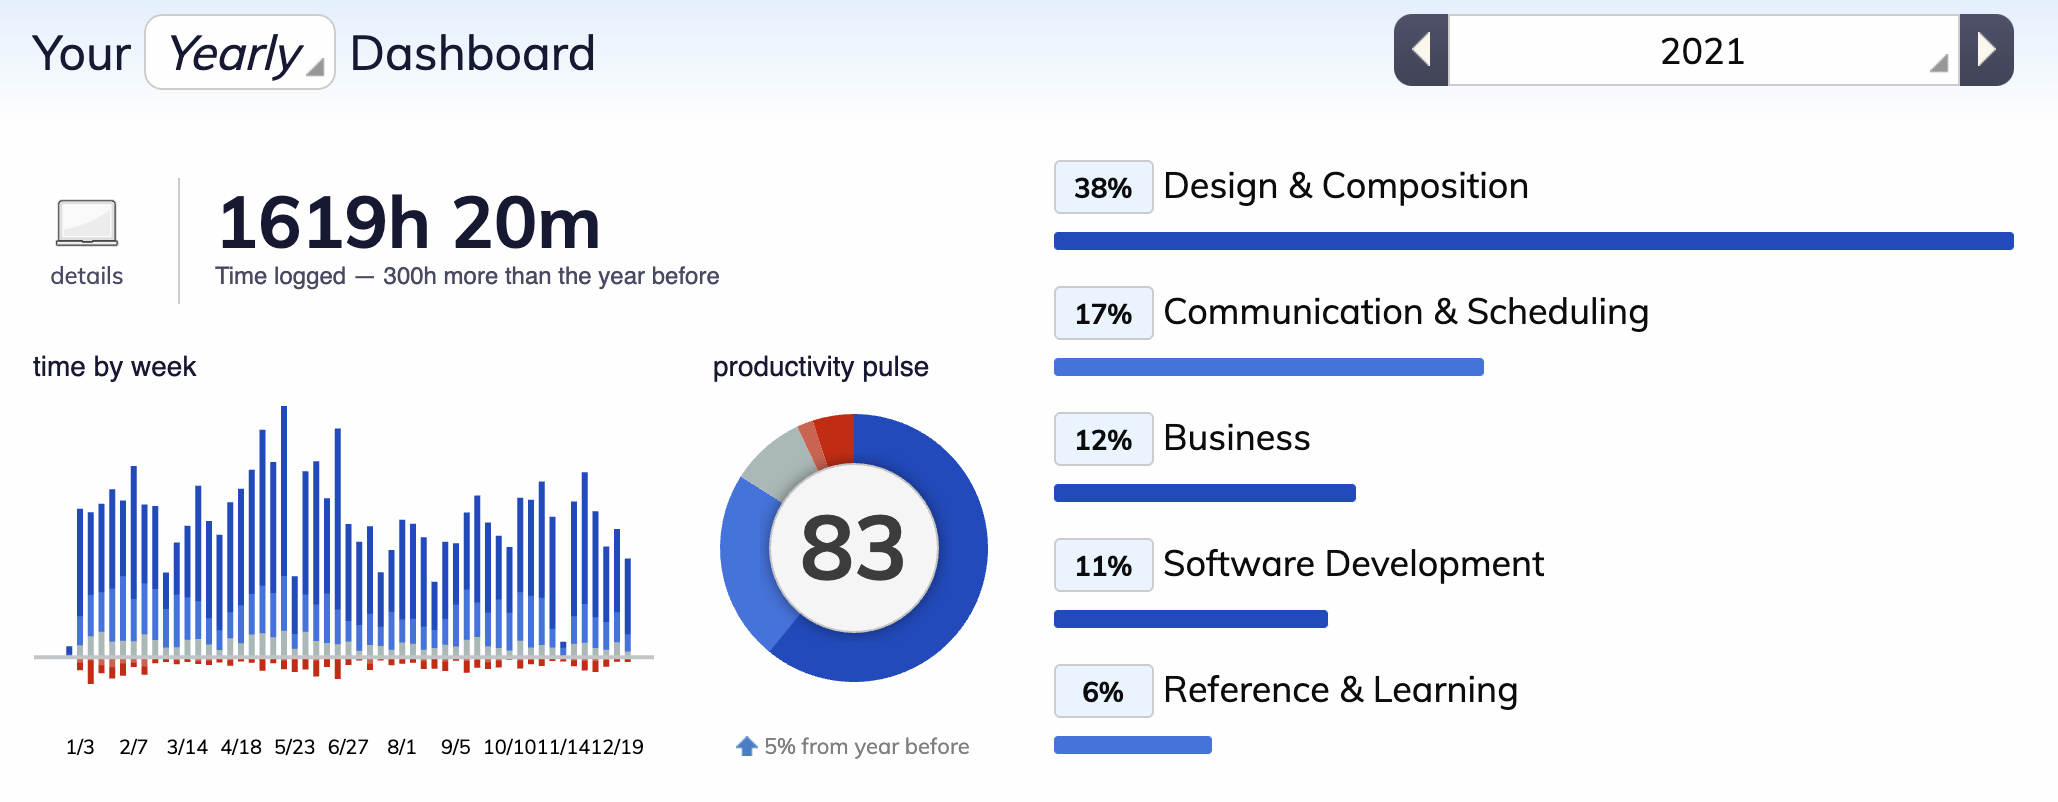
My Project Time: 1,686.8 total project hours
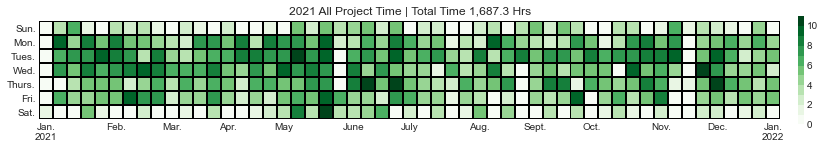
According to my Toggl logs, I logged some amount of project time on 334 days, which added up to 1,686.8 total project hours.
Breakdown Workspaces Time:

I divide my work into three broad and somewhat overlapping buckets:
- Personal Workplace includes organizational work, weekly reviews, studies, writing, and music.
- Client Development, Design and Growth Hacking includes paid consulting work as well as some misc work related to that.
- My Startup Projects includes new projects I build, design and develop as well as some side hustles I operate.
Here is how my project time got split up:
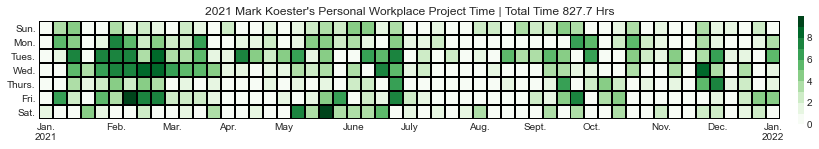
- Personal Workplace: 827:42:19
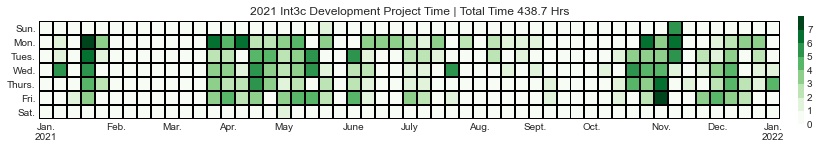
- Client Development, Design and Growth Hacking: 438:42:30
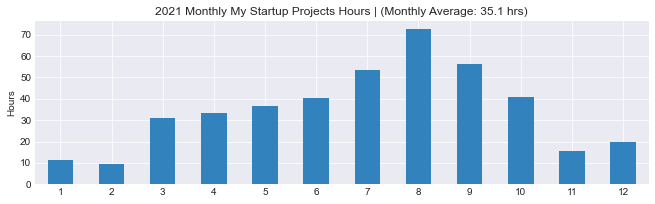
- My Startup Projects: 420:54:43
It’s life confirming to see how much of my time goes to my own projects (personal and startups), while also maintaining a consistent push on paid consulting too.
While previous years were tracked somewhat differently, you can see in my year by year breakdown some of these changes over time.
202201031030.02
Daily Heatmap: Breakdown of Workspaces:
Client Consulting: Design, Development and Growth Marketing
Personal Projects, Writing, Music Production and Studies
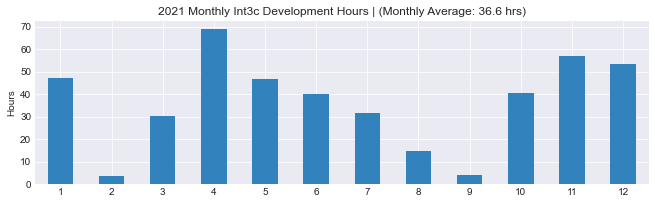
This chart offers me an interesting background to my memories of 2021. Specifically from Jan to July I was researching and writing a book. I delivered my first draft in early July. The later half of the year I got sucked into other work and stopped writing. Interestingly I did start doing more music then (see chart below).
Startup Projects:
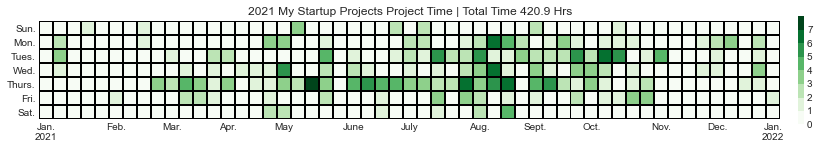
It’s interesting to see a block of Thursday in green since it reminds me of a certain startup cadence with day-long meetings for an early stage biotech where I was leading up marketing and growth.
Montly Trends: Breakdown of Workspaces:
The Big Blocks of My Project Time
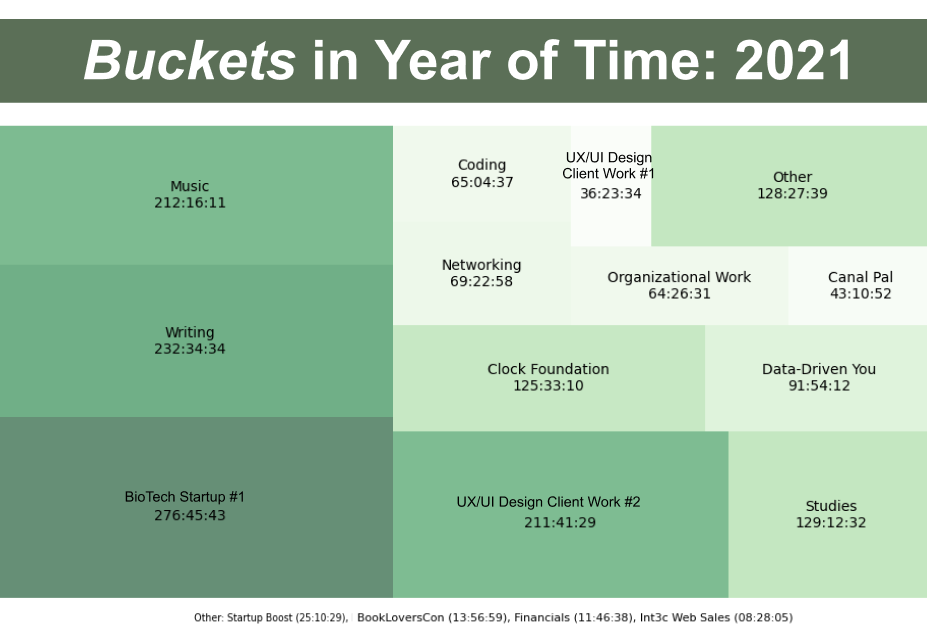
There are a number of ways to breakdown and visualize time, but I’m a big fan of the treemap visualization. Basically it takes a quantity (like time) and generates blocks of each so things are comparable. Above is my year in project time broken down by specific projects.
Here are a few noteworthy projects (at least for me):
- BioTech Startup: 276h
- Writing: 232.5h with 12h in an online course, 53h on actual book writing, 11h on book interviews and 11.5h on book organization
- Music: 212.25h
- Consulting Project: 211.75h
- Studies: 129.25h with a heavy focus on biology especially mitocondria and epigenetics
Thinking back I still think I didn’t quite put in enough time to make the necessary progress to properly advance and finish my book in first half of 2021. I probably needed to carve out more time or establishing stronger routines so my input time was adequate for output (pages written and chapters completed).
How did I split up my week between areas?
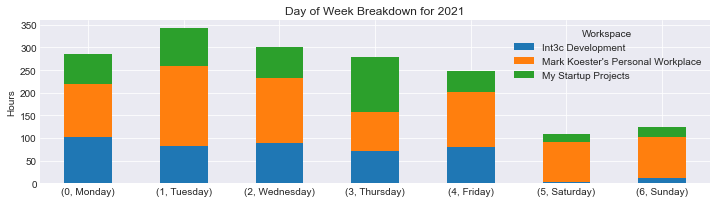
Thursday was definitely my startup day. Monday to Friday also represented my client work days. I still spent a lot of week days on personal projects too.
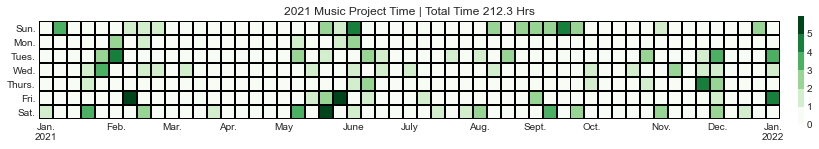
Music Learning, Production and Creation Time: 212.3 hours
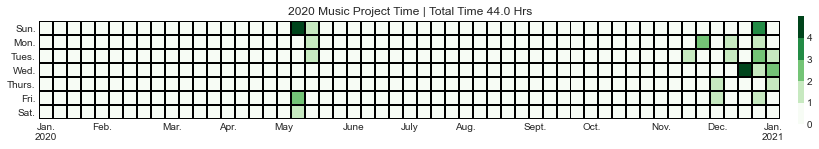
In 2020 (ironically while in lockdown), I started playing around with music production, which culimating with a lot of playing around and practicing at the end of 2020:
2021 continued my interest and engagement with music as reflected in my heatmap:
Total YouTube Time: 233.5 hours
A couple of years ago I took a 30-day break from YouTube in order to better manage how much time I was spending watching videos on the platform. While I eventually went back to using YouTube, mostly for learning purposes and occassionally for sports highlights, I have significantly cut back on my watching over. Here’s my breakdown for 2021:
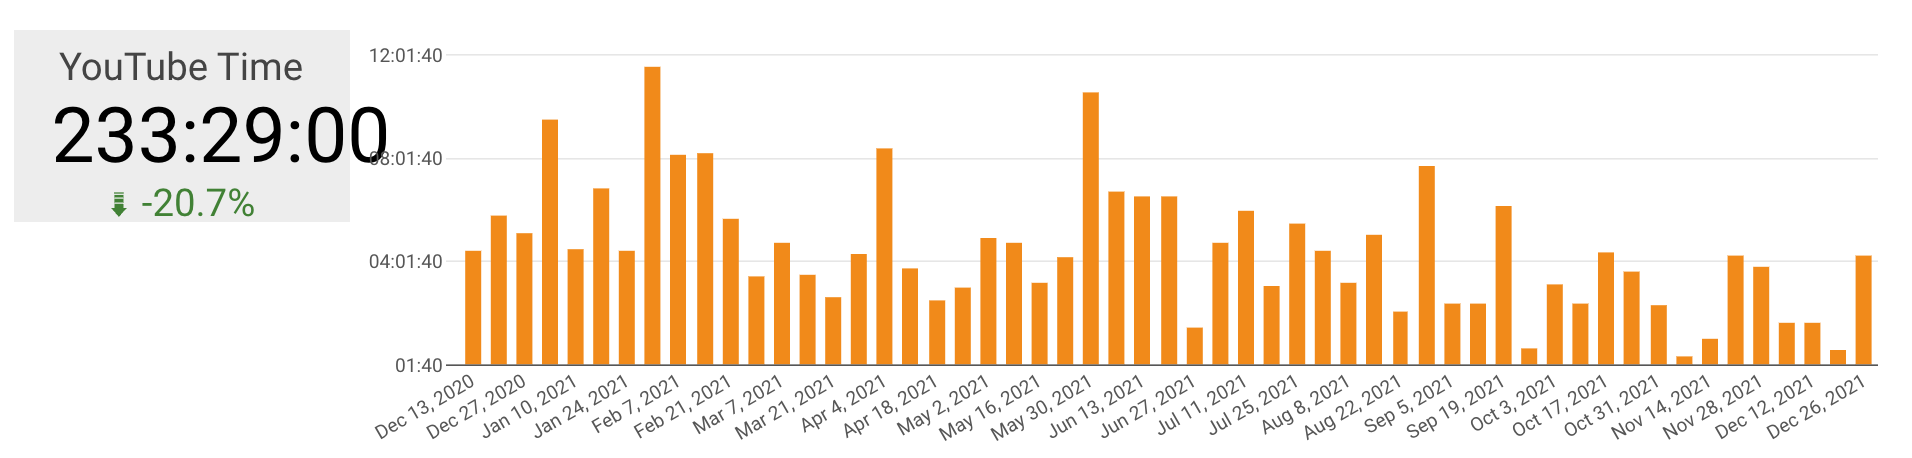
In 2020 I watched 301 hours on YouTube. So all in all I decreased my Youtube time by nearly 68 hours!
How much time was capture? How much is unknown?
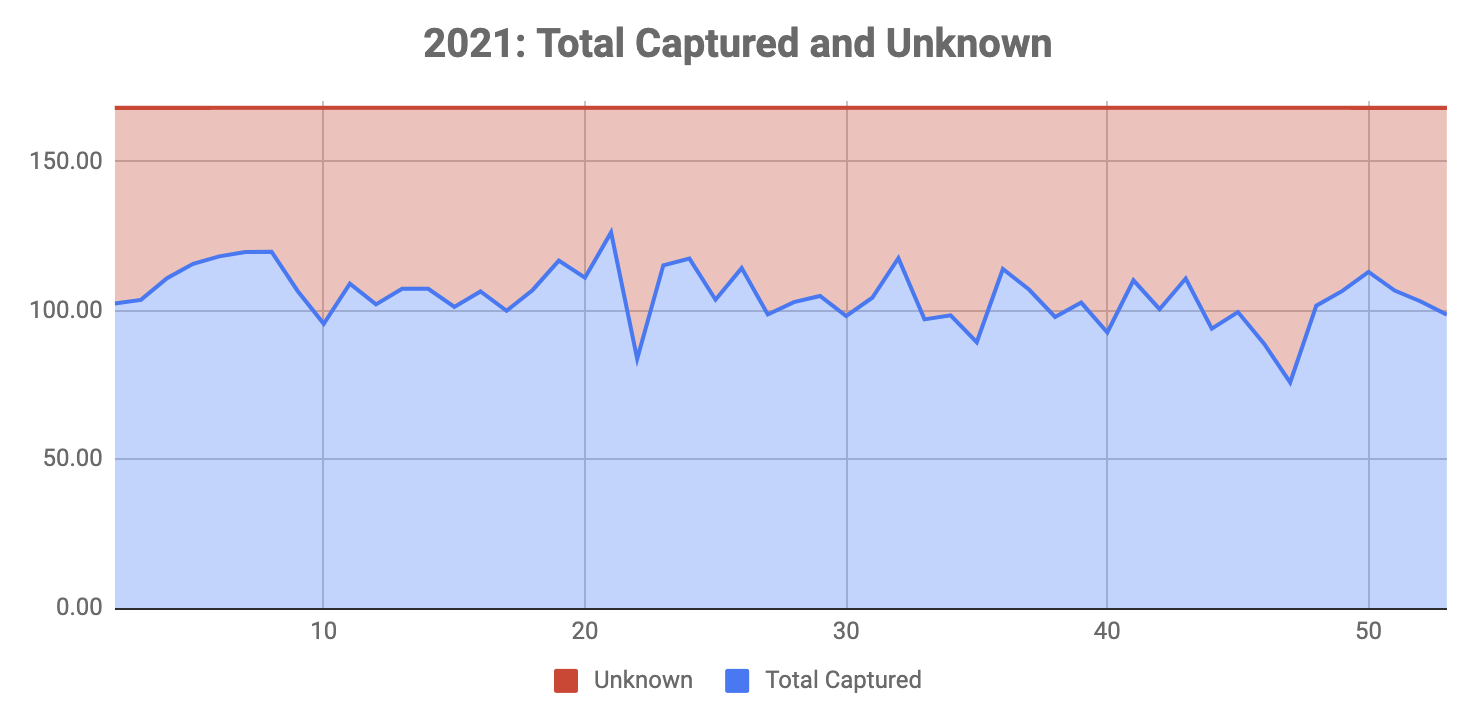
Using my weekly logs and a calculation of total trackable time, it’s interesting to see how much time each week remains unknown or at least untracked. It could be estimate from this block how much time I spent on socializing, eating, cooking, cleaning and even just walking about.
How I Tracked My Time
I’m overdue on writing a new guide to time tracking. For the curious, here are the main components of my time tracking:
- I track computer usage using RescueTime, a product I’ve used for a number of years and is integral for objectively knowing how long I spend on my computer and which tools I use most. For more on RescueTime, checkout How to Create a Time Tracking Dashboard using RescueTime, IFTTT and Google Sheets.
- In order to quantify my project time, I use a manual time logging tool called Toggl, which is free and works on web, mobile and Mac. Manual time tracking does require more but represent a true metric of my input.
- Device tracking remains difficult to aggregate with some minimal effort. In my case, for device tracking, like my iPad and iPhone each week I write down or take a screenshot of my screentime and then log it into a spreadsheet. I include noting this data in my weekly review
Conclusions: General Thoughts and Reflections on My Year in Time
I’ve been tracking my time for a number of years and doing various forms of yearly and weekly reviews for a long time too. While a lot attention might go to the technicalities to tracking time, I think the big miss for most people is actually engaging and reflecting on our time usage. If you want to improve your self-awareness on where your time goes and improve your ability to reach your goals, then measuring and reflecting on your time usage can be a huge enabler.
Overall, compared with 2020 and 2019, my 2021 time had many similar elements. I was deeply engaged in a range of activities and projects. There were noticable periods on different projects and areas throughout the year. I can pull out single statistics on my year but this particular year can’t be broken down into a single unit of time. Instead my year is more like a tapestry of different time engagements and changes.
If you had to put numbers in context, we all get 1440 minutes per day and 168 hours per week. If we exclude about 8 hours per day we should be spending on sleep, we end up with approximately 5,840 hours to “live with” per year.
To compare these contextual numbers with my specific numbers, I ended up spending 2647 hours on devices (phone, tablet and computer), which means about 45% of my available yearly time was “screened”. That’s obvious a lot of screen time. But if you consider I spent 1,686.8 hours on consciously logged and tracked projects, then 63.7% of my screentime was for my projects. This means over half of my device time was contributing to advancing my projects and goals.
All told, of my total available active life time, 28.8% was on project time. Or roughly one-fourth of my doings time was for projects for self, pay or entrepreneurial. I think this kind of precise time KPI is key for my overall progress in life, work or otherwise.
Relooking at the breakdown of my computer time and projects I engaged with, I think I’m quite happy with where my year in time went. Obviously I didn’t acheive all of my goals, in particular I failed to finish my book nor get it published. Looking at the logs, it seems like I didn’t set aside enough time nor did I have quite the time put in to expect a completed book anyways. I think 200-300 hours would be a better benchmark for a 200-300 page book. So if and when I do plan to work on this or another book, I’ll need to carve out more consistent writing habits and put in more time overall too.
Regardless of my goals, it’s revealing to see where my time went and removes a lot of the ambiguity about where my last year’s worth of time and attention went. If I had to reorient my year and years ahead, it would be continuing to use time tracking logs to reflect on how things are going and define progress metrics to reach goals and finish projects. For example, it will be interesting to look at my 2022 time logs in relation to writing and producing my first music album.
Put another way, if I expect to take on hard goals and challenging projects pursued over a long period, “time put in” or time input remains a critical component. Tracking progress should consider input time as part of that equation. Furthermore the closer I can tie the time I put in with the intended output (like songs produced or chapters written), the better I might be at pursuing this challenging goals. Obviously this assumes a very deterministic model of goal achievement and negates the imprecise nature of creative pursuits. That said, a heuristic like time inputted is essential.
While an undergrad I took a philosophy class on Metaphysics and being the arrogant undergrad I was I thought I could pull off finally “proving” what is time. Sadly I wasn’t quite able to accomplish that, but it did offer me a lot early ideas about the nature of time and my own existential engagement with time-bound living. Over the last several years, my own time tracking and time-based reflections have taught me much about what I actually do in my life’s time and how I hope to spend my life-time ahead.
If you like to explore the intersection of time as an existential limiter and time management as a practical reality to deal with manage the value of our own temporality, I highly recommend Four Thousand Weeks by Oliver Burkeman, which I reviewed and wrote on in this blog post. My pithy summary of the book and its main insights is that time is an existential reality that many of us ignore or deny as being as important as it should be. While there is too much spent on productivity hacks, time management is better thought of and framed as a way of managing what matters to you and defines, namely your time on this earth.
In short to borrow a quote from the book, we should strive to accept the “notion that fulfillment might lie in embracing, rather than denying, our temporal limitations.” (emphasis mine)
Best wishes and if you get inspired and end up tracking your time or life or progress, drop me a note about how it went. Bonus points if you share a chart or two.
Check out other posts, data visualizations and infographics from my year in data.