At the start of each new year, I pull together all of my data from a range of self-tracking services. I then use that data to calculate average numbers and generate charts and graphs about different aspects of my past year. I then use my data visualizations to think about my year past and reflect about the year to come.
Below are a subset of my favorite data pieces from 2021 ranging from health related (like sleep and excerise) to productivity (like tasks completed) to various measure of creative output and learning (like book read, words written or notes taken). I’ve shared a few general observations and reflections based on this data.
[NOTE: I’ve excluded my 2021 book reading and 2021 time tracking which I shared and wrote about separately.]
While tracking and data viz might be the coolest aspect, I believe that engagement and reflection (i.e. thinking as self about and with data) is more benefical and has the potential to drive deeply meaningful and impactful self-awarness.
Are you interested in seeing my previous years? Check out my year in data series. Want to know how to generate your own yearly data visualizations? See Give Me My Data, Tell Me a Story or my open source project QS Ledger. Curious to learn more about how I track my life and quantified self? Pick a post from my on-going “tracking everything” blog series.
Let’s jump into a few slices of my year in data, 2021…
Health and Exercise
Sleep: 7.38 median hours of sleep per night
I’ve been tracking my sleep in some capacity since 2017, originally using sleep apps on my iPhone, later my Apple Watch and now using Oura watch. Oura provides not only great sleep data but also allows me to track my heart rate variability and readiness.
According to my Oura logs, I had:
- 334 days of tracked sleep
- 7.38 median hours of sleep per night
- 7.39 average hours of sleep per night
- 81.1 average sleep score
- 88.6 average sleep efficiency
- 46.7 average hr
- 14.0 average breaths per minute
Average Sleep by Night of the Week:
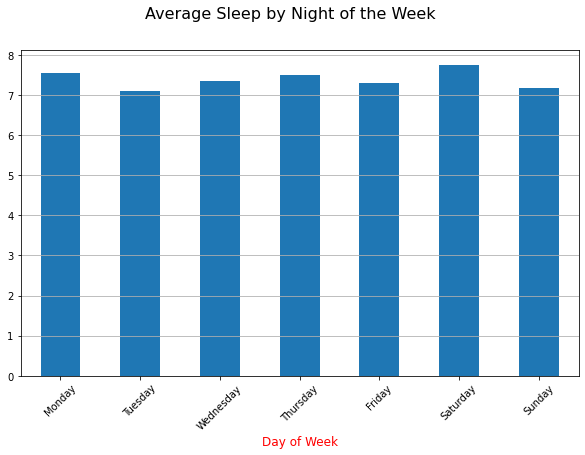
I generally got slightly more sleep on Saturdays and Mondays but in general my day of week sleep averages were pretty similar. This is somewhat of a departure from my 10-day sleeping average as indicated in this chart:
10 Day Sleep Rolling Average:
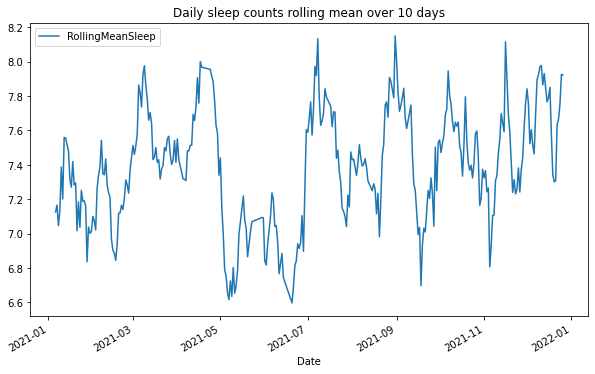
In April and May, I had a pretty steep decline in sleep per night. I saw some similar drops at some other points though less sustained. These drops in average would indicate some likely degrated performance in other areas. It would be interesting to compare with other data points.
Takeaways: Overall, I’m happy with my general sleep quantity but these periodic drops should be avoided since while a night or two of poor sleep might be recoverable but longer periods like these definitely would take a physical, emotional and cognitive toll on me. It would be best to try and creep up my overall average to above 7h 30 per night.
Exercise: Running and Cycling
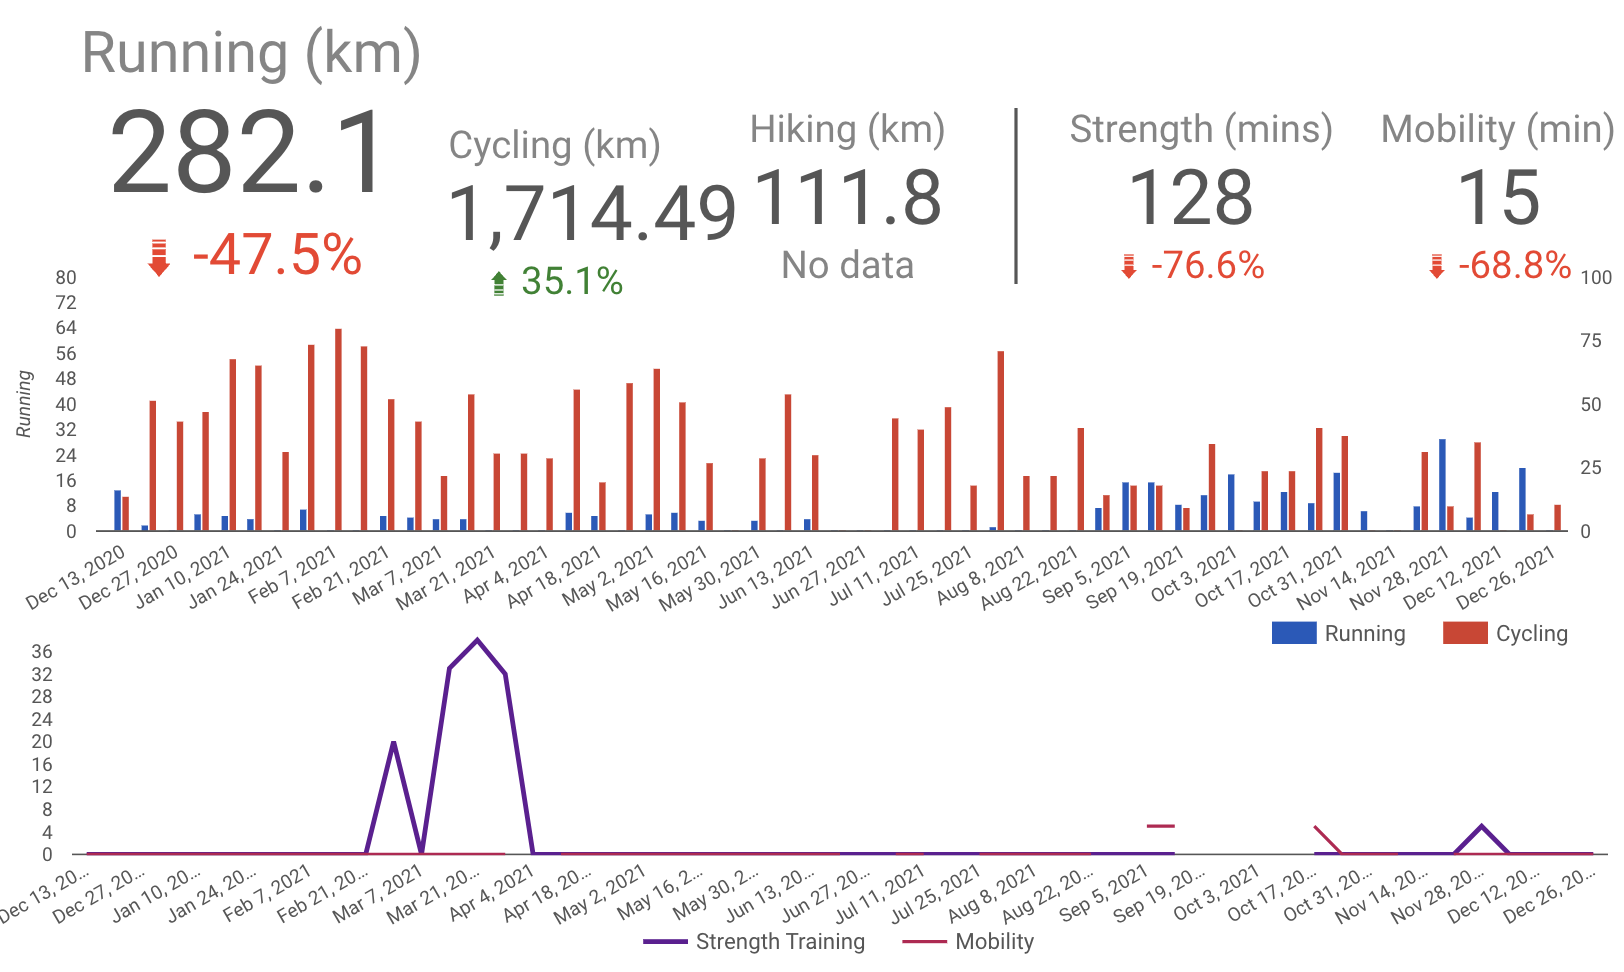
2021 marked a continuation of a general shift away from running (about 50% less than 2020) and towards more cycling (35% increase). Here are some notable data points:
- 153 days active (according to Strava)
- 127 total active hours
- 1978 total distance (combined cycling and running)
My Strava data shows some clear trends with much more activity in first half of year than second. This would indicate a general lack of consistency in my exercise habits.
Takeaways: While work and life situations might pull me to work more, a consistent exercise regime might be just as beneficial for my mood and cognitive performance. As a rule, I’d like to keep striving for consistency week to week as my main target. I should strive for 1-3 runs and 1-3 bikes per week, which combined with 1-3 canoe rides and walking should provide some nice healthy exericse.
Productive Output and Creativity
(Todoist) Tasks: Total Tasks Completed: 2,120


Inspired years ago by “The Getting Things Done” productivity philosophy, I’ve been using task management tools for a number of years and actively task tracking. I currently use Todoist to track my tasks, which combined with my yearly time tracking logs gives me a pretty accurate portrait of my productive input and output.
Here are some notable stats:
- Total Tasks Completed: 2,120
- Daily Task Average: 6.6
- Monthly Task Average: 176.7 with my top months being June (203 tasks) and May (201).
Here is a breakdown with heatmaps of some top projects:
Writing

Studies

Music

BioTech Startup Founder, Head of Design and Product Marketing

Networking

Interestingly my top startup and client projects each had the most completed tasks (320 and 236 respectively). In terms of my personal creative projects writing had 203 and music 183.
I spent much of the first half of the year working on a manuscript on the science of goals, which I still haven’t completed yet but plan to work more on.
As my second formal year studying music production, I definitely put in a lot of time on learning and doing. My side hustle, Canal Pals, where we offer private tours and boat rentals on the Venice Canals in Los Angles was also a big component of getting things done with 129 tasks.
Comparison of Tasks Per Year Over Time
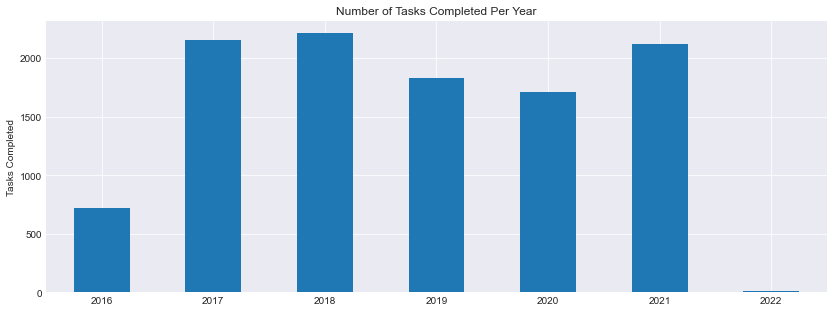
Compared with previous years, 2021 was a return to a certain stability of productive output, at least as considered in terms of tasks completed. 2019 and 2020 both had less tasks completed, which are not surprising since 2019 had a lot of travel and my move back to the US and 2020 was COVID lockdown life.
Takeaways: In general I’m happy with my ability to embrace varying tasks and projects across my year. Changing it up in terms of client, startup and personal focuses helps me learn and improve (and is a lot of fun too). While I’m disappointed that I didn’t “finish” my book in 2021, I’m glad of the effort I put and that I have a solid initial manuscript to build and improve and potentially spin it out into other creative avenues as a product or blog post series. All in all I think my baseline habit goals of 4 tasks a day and 25 per week work great and keep my active and ensure each day I at least “show up” and complete some tasks.
Writing: 180,511 Typed Creative and Study Words


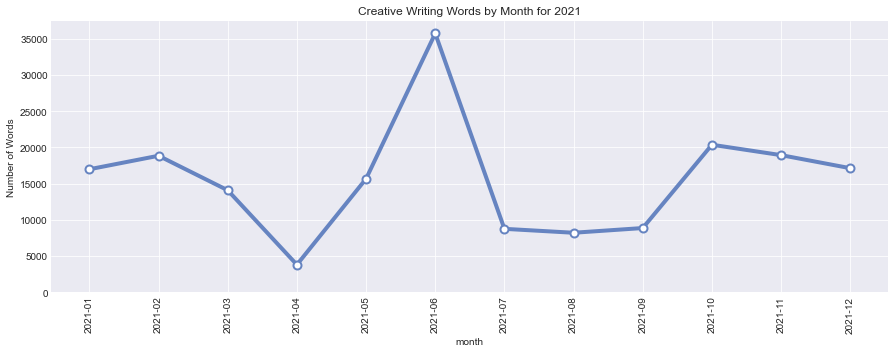
I dedicated a good part of 2021 to writing, in particular book writing. I joined an online class and managed to complete a lousy first manuscript on the science of goals. While I didn’t quite manage to finish the goal of publishing a book, I developed a ton of skills, a research approach to book writing, and some great writing practices.
My writing and note-taking tools have remainined the same for last couple yearly. Specifically I use The Archive and Typora for plaintext writing in markdown format and track my word count on Mac with WordCounter. I also use a git version control method to track changes over time. I then use some scripting to track my writing stats.
So how did my writing in terms of typed words itself track?
- 180,511 total typed creative words (according to WordCounter)
- 633.5 average number of written words per day
- Monday was my most productive writing day with an average of 900 words per day.
- My max writing day was on June 25 with 4,610 words
Looking at the above charts shows an initially strong start in early 2021 but a drop in April and May. But June and early July I had increased my writing output.
Comparison of Tasks Per Year Over Time
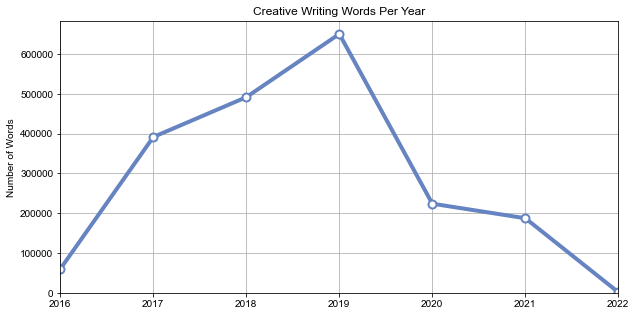
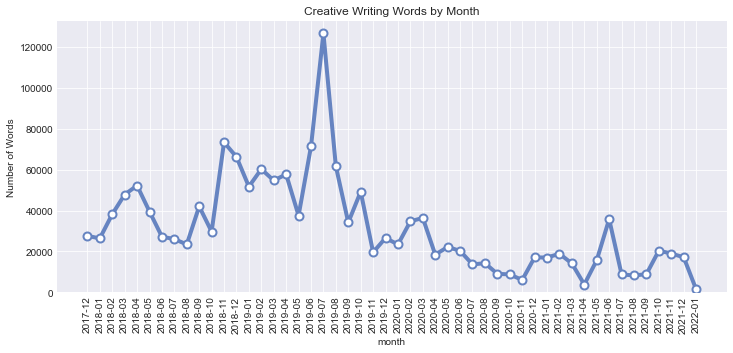
While I did do a good deal of writing in 2021, looking back to 2017, 2018 and even 2019, we can clearly see that I was typing and creatively putting words down much more than I have recently. A quick peak at my blog posts from those periods is pretty indicative of showing up and writing more regularly then too.
What was my average number of written words per day?
- 2021: 633.5
- 2020: 757.0
- 2019: 1,897.8
Takeaways: Even though I’m happy that I “finished” a draft of a long-form of writing, my writing stats don’t lie. I didn’t write as much as I have in the past. This is largely a question of the time I put into writing compared with past years. Living in the US requires me to make more money and certain personal and professional projects draw more of my attention and time, leaving me short on writing time. Writing as a goal and habit obviously wasn’t as important as it was in 2020 and 2021 as past years. Looking at my goal of writing and publishing a book, I need to get myself into similar situation and habits as I had in previous years if I hope to reach this goal and related writing goals. Much like my music production goals, if I want to write and publish, I need to write and publish.
Check out other posts, data visualizations and infographics from my year in data.
