![]()
RescueTime is one of my favorite ways to track my life. It’s a great passive way to know where your time is going on your computer. But how to collect your data and what to do with all that data once you get it?
Increasingly I’ve been using various automation services as one of my data collection methods. While you can use manual exports or code like QS Ledger to collect data from different tracking services, an automation service like IFTTT can automate the data collection. That way all of your data is stored into Google Sheets for easy access and even simple data visualization and data analysis.
Once your data is in Google Sheets, you can leverage custom functions and App Script to process and prepare that data. In turn, the ubiquity of Google Sheets means it’s easy to then pull data from there into your favorite visualization tools like Google Data Studio, Tableau or Plot.ly.
I see a lot of value in time tracking and time data. Personally, I started to track using time tracking tools when I become a freelance developer several years. Over time I discovered how time tracking made me conscious of my time usage, I learned to use time data in my weekly reviews and even explored a year of time tracking too.
In this post, I want to walkthrough setting up a simple time tracking dashboard with RescueTime, IFTTT and Google Sheets. First, we will use IFTTT for data collection from RescueTime into Google Sheets. We will then leverage some code in Google App Script to process and prepare our data. We will use some custom functions in Google Sheets to create some time dimensions from our date field. Finally, we will use some simple pivot tables and charts to do some personal data analysis. We are turning our tracking data into improved self-understanding.
The goal of this post show you some advanced functions for data processing inside Google Sheets. You’ll learn how to add and leverage custom code with Google App Scripts to extract information and do calculations. I’ll show you how to use array formulas to process columns of data in bulk. Finally, once we’ve done the hard technical work of data processing and data preparation, you’ll discover how easy it is to do some personal data analysis using pivot tables and charts and graphs.
Hold on to your spreadsheets. Let’s get started with some advanced data processing with Google Sheets!
Time Tracking and Passive Computer Usage from RescueTime
RescueTime is a great productivity tool for anyone trying to improve their time management or to become a bit more data-driven in their productivity and goals.
After installing a simple background application on your computer, RescueTime will track your usage of various applications and time spent on different websites. Your computer usage data is then synced to their site where you can view various reports and see a breakdown of different categories and your productivity score.
Overall, the tracking experience with RescueTime is great, and the time reports provided are detailed, useful and clear.
While there are some other great alternative time tracking tools, RescueTime remains one of my favorites and one I recommend for anyone looking to setup their self-tracking and quantified self toolkit.
So, now that you are tracking your computer usage with RescueTime, what can you do to collect and engage with our data outside of the site?
Collecting Your Time Data from RescueTime
While a lot of focus is put on data privacy, for me data accessibility is just as important. Data accessibility describes the idea that you should have access to data you create inside a service.
RescueTime provides great data accessibility, and there are several ways to get your data.
The easiest option is using their manual exports on the site. Depending on the report you are looking at their should be an export option to then download your data in a CSV. While this option is the easiest, the data is in aggregate format, meaning you are getting it in chunks like day, week or month.
In order to get the “best” data, you can some code to directly pull your data from the API. RescueTime’s API is well-documented and well-maintained. I’ve even written some code so you can use to start collecting your RescueTime data using Python. The main benefit of using code is that you can collect your legacy data as well as get your tracking logs at a low level like by hour or even by minute. Furthermore, the data you get from the API is really well-structured with clear designation for the category, application and seconds spent.
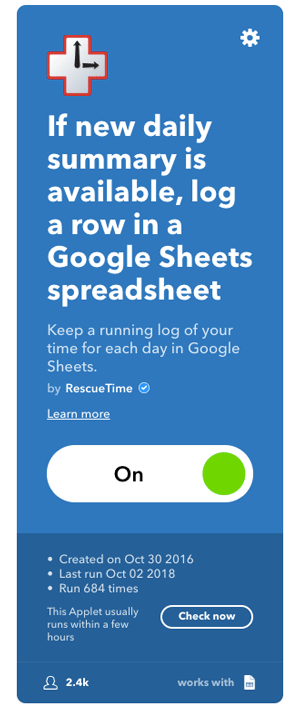
The most convenient way to collect your on-going time data from RescueTime is with IFTTT. IFTTTT stands for “if this, then that.” It is a well-known automation service that allows you to integrate and glue different services together. For example, you can automate re-posting an Instagram post to Twitter or Facebook. The basic logic of IFTTT is that you have services you connect to, and then using events from those services, you trigger customizable actions. In their lingo, these events or triggers are the “IF” and the actions are the “THAT.”
There are hundreds of services integrated into IFTTT ranging from common productivity tools to maker platforms to everything in-between. This makes IFTTT a great way to do your tracking data collection too. For example, you could use Weather Underground to store an hourly log of the weather in your city into Google Sheets. That way you can compare the effect of weather on your productivity and motivation to do workouts.
RescueTime has several triggers you can use. For data collection purposes, the key ones are Daily and Weekly Summaries. These are your aggregate information on where your time went on the most recent day or week.
To use these, all you need to do is to create an account on IFTTT and then integrate RescueTime and Google Sheets. Then create a recipe that takes the trigger of “Daily Summary” as the IF or trigger event, and add Google Sheets as your action target. You can then configure which fields you want to use and the location for storing this Google Sheets. I recommend leaving all of the data fields as is by default.
After you’ve added this recipe, once a day your daily summary data from RescueTime will be pushed into a Google Sheet via IFTTT. In its raw state it will look something like this:

Now that we go our data collection process setup, let’s explore this data and start doing some data processing inside Google Sheets.
Time Data Processing in Google Sheets
If you’ve just started collecting data into Google Sheets from RescueTime, there are a couple of initial steps you should do first.
Add Headers
The first thing you’ll want to do is add some headers. Copy your configuration in IFTTT to add the header columns for:
TotalTime, AllProductiveTime, AllDistractingTime, VeryProductiveTime, ProductiveTime, NeutralTime, DistractingTime, VeryDistractingTime, BusinessTime, CommunicationAndSchedulingTime, SocialNetworkingTime, DesignAndCompositionTime, EntertainmentTime, NewsTime, SoftwareDevelopmentTime, ReferenceAndLearningTime, ShoppingTime, UtilitiesTime
Set Date Format on Date Field
By default Google Sheets will set all of the columns as plain text. In order to leverage more advanced functions, you’ll need to convert your first column of Date to a date time by selecting the column and going into Format > Number > Date.
We will be using the date field shortly to create some additional date time dimensions.
Fixing the Duration Fields with Google App Script: Step 1
At this stage, you’ll probably have noticed RescueTime’s imported duration format, which looks like 4h 31m, 21m 39s, 5h 32m, etc. This is a human-readable duration format, and some spreadsheet applications can read and parse this. Unfortunately Google Sheets cannot. This creates a bit of a challenge for us if we want to use this data.
Let’s create some custom using App Script to parse this into a proper duration cell.
First, go into the menu under Tools and select “Script Editor.” This should open up a new browser tab that looks like this:
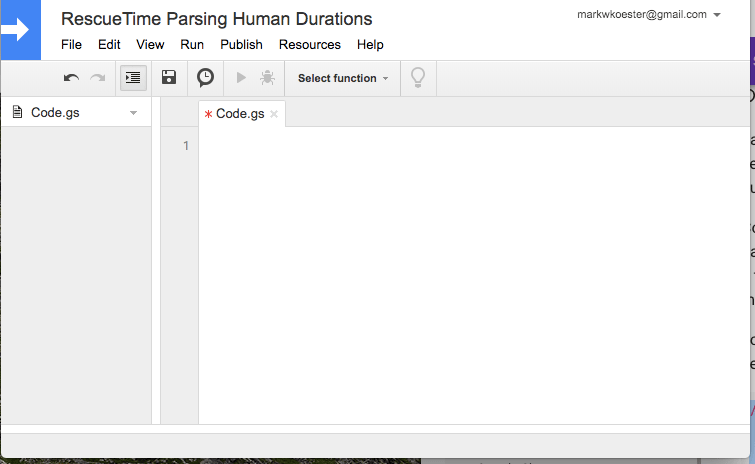
If you run into an issue, make sure you’ve connected Script Editor already as one of your Google Services and, as a best practice, log out of all other Google Account and use a single account.
Inside of the code editor paste in this code:
function ExtractDuration(value) {
  if (value.map) {
    // Test whether input is an array.
    return value.map(ExtractDuration); // Recurse over array if so.
  } else {
    // Code to Extract Elements of Duration
    var match = value.match(/(\d+) ?h/i);
    var hours = match ? match[1] : 0;
    match = value.match(/(\d+) ?m/i);
    var minutes = match ? match[1] : 0;
    match = value.match(/(\d+) ?s/i);
    var seconds = match ? match[1] : 0;
    if (hours || minutes || seconds) {
      // Recombine Elements into Google's Duration Number
      var duration = hours / 24 + minutes / 1440 + seconds / 86400;
    }
    return duration;
  }
}
Now save your code.
Return to your spreadsheet, scroll to the last row of the spreadsheet with data and paste in this formula to test if your function works:
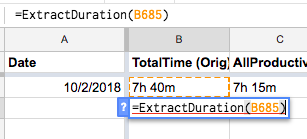
After a few seconds, it should display the result like this: 0.3194444444.
Select that cell and go back into Format > Number and Select Duration. The cells should be formatted and displaying the correct format for duration in Google Sheets now.

Let’s now use this code to bulk update all of our existing data.
Fixing the Duration Fields with Google App Script: Step 2
We need to do a bit of initial setup so we can start organized.
- Go to the top of your spreadsheet and copy your existing head row.
- Now scroll to the final column and add a new blank column.
- Paste in the original header row.
- Now go back to the original header rows and append Orig or some other marker.
The end result should look something like this:

Fixing the Duration Fields with Google App Script: Step 3
Now we need to apply our custom function to all of our existing rows. Technically we could do a simple custom function call and use relative references to then update all of our data:

This method will work, but it will be slow since it will require a call for every single cell and additionally it will require pasting in this formula every time a new row is added by IFTTT.
The solution is to use an ARRAYFORMULA. An array formula is a fairly advanced feature in spreadsheets that allows you to pass in a range of data and then run a function onto each element and then output the results.
If we apply an array formula with our custom function to our new columns, the code would look like this:

This will now iterate through each cell and update it accordingly, including any new rows that get added!
An even better way to do this is add an if statement to check if there is data in the first place and then run our custom formula. The final code looks like this:
=arrayformula( if (len(S2:S), ExtractDuration(S2:S), iferror(1/0) ))
After adding this formula to each of our columns, the end result should look like this:

Your duration fields are now properly formatted for Google and most other spreadsheet and visualization tools. At this stage, depending on the program you will be using for Data Visualization, you can start creating your reports and graphs.
Converting Duration to Seconds with Google App Script
Unfortunately, Google Sheets and Google Data Studio for that matter doesn’t work well with just a duration field. What we really want is a number like seconds or minutes. So, instead of changing the human readable duration to Google duration, let’s convert it to seconds.
Open up Google Script editor again and add the following code:
function ExtractDur2Sec(value) {
  if (value.map) {
    // Test whether input is an array.
    return value.map(ExtractDur2Sec); // Recurse over array if so.
  } else {
    // Code to Extract Elements of Duration
    var match = value.match(/(\d+) ?h/i);
    var hours = match ? match[1] : 0;
    match = value.match(/(\d+) ?m/i);
    var minutes = match ? match[1] : 0;
    match = value.match(/(\d+) ?s/i);
    var seconds = match ? match[1] : 0;
    // Get total seconds
    total_seconds = hours * 3600 + minutes * 60 + seconds;
    return total_seconds;
  }
}
Now update your columns to use this new function like this:

Additionally you will need to change the cell format to number.
Viola you now have your time tracking data as seconds!
Let’s create a few more time dimensions before starting our data analysis and visualization step.
Creating Time Dimensions with Array Formulas and Functions in Google Sheets
In data science, we often make a distinction between dimensions and metrics. Metrics are the actual quantifiable numbers. For example, your metrics might be temperature, units sold, time, etc. Dimensions are the way we slice and dice and group that data. For example, dimensions could be region, day of week, week, month, hour, etc. Data that has both dimensions and metrics allows you to create a report showing number of sales by time of day or day of the week or month.
Let’s create a few simple time dimensions to our data analysis.
Go to the end of your spreadsheet and add five new columns.
Let’s start by creating a year column. Add a header label of “Year” and paste the following code into the cell below:
=arrayformula( if( len(A2:A), YEAR(A2:A), iferror(1/0) ) )
This formula is checking for data in the A column and if there is, it then runs the YEAR formula to extract the year.
For month, week number, and week day number, you can use these formulas:
=arrayformula( if( len(A2:A), MONTH(A2:A), iferror(1/0) ) )

=arrayformula( if( len(A2:A), WEEKNUM(A2:A), iferror(1/0) ) )

=arrayformula( if( len(A2:A), WEEKDAY(A2:A), iferror(1/0) ) )
There is no special function to get the week day name, but you can easily create it by combining weeknum method with choose. Here is an example:
=arrayformula( if( len(A2:A), CHOOSE( WEEKDAY(A2:A), "Sun", "Mon", "Tues", "Wed", "Thurs", "Fri", "Sat"), iferror(1/0) ) )
This formula extracts the week day number and then according to its position from 1 to 7, applies the name from our list.
Then end result is several dimensions in which to filter and explore our data in time:
![]()
Now that we’ve done our data processing, let’s start creating some charts and reports!
Time Data Analysis in Google Sheets
Time is an essential aspect in all of our lives. Whether you are president or CEO or just a normal person, we all get the same amount of time in a week: 168 hours. You might think about time as our existential time limit. As such, time data can be a particularly valuable piece of data to know and change your life.
So, how can we do some personal data analysis using our time tracking data?
Start with a Question or Goal
Personal data analysis is a huge topic onto itself. From my experience, one of the key aspect to remember when you are trying to use data in our lives is to come up with a question you are trying to answer or a goal you want to measure.
Then use your tracking and your tracking data to help you understand and answer that question or provide a kind of “scoreboard” to check your progress.
For my purposes, I’m going to focus on two questions:
- What is the general breakdown of my time? i.e. where is my time going?
- Am I spending my time consistently on the goals and areas that matter to me?
For this translates to, am I spending most of my time on writing, software development and learning? Or am I losing my time to things like email, social, media, etc?
Breakdown of My Productivity
Pivot tables allow you to create summarization tables of your data. Let’s create a few to explore where my time is going.
In your first sheet, go up to the menu under “Data” and select pivot table. This should open a blank sheet with a right panel opened.
- Inside of “Pivot Table Editor” check that you have all of your data adding in the first field. Mine looks like this: Sheet1!A1:AP1000
- In “Rows,” add a row for Week (if you don’t have much data yet, feel free to use “Date” instead for now.)
- In “Values” add VeryProductiveTime, ProductiveTime, Neutral Time, DistractingTime, and VeryDistractingTime.
- Under Filters, add a filter for year and select the year you want to use. In my case, I’m using 2018.
At this point, it should look something like this:
![]()
What this pivot table has done is taken each of the rows that match the week and done a sum of the total seconds and then created a column for the corresponding result.
At this point, it become trivial to create a chart. Manually select columns from A to F down to the final row before the total. Then go to Insert and select “Chart.” By default Google Sheets created a stacked column chart. Here is my slightly modified version with a title and some labels.
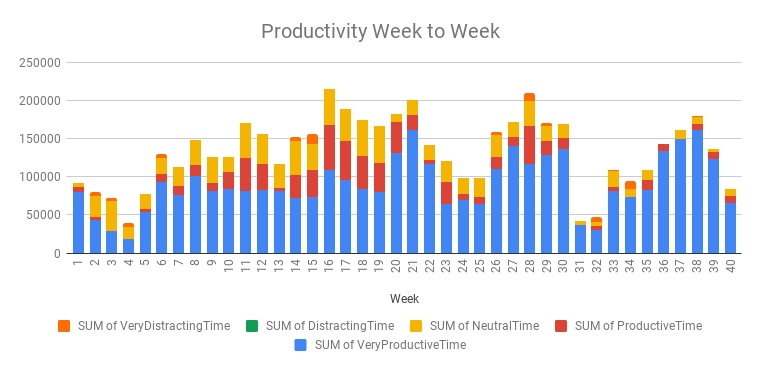
Already looking at my data, I can see some interesting things.
First off, I don’t see much I can see a lot of distracting or very distracting time. This is largely due to a lifestyle change where I made computer into a more work-focused tool and instead most of my distraction and entertainment time is on my tablet or phone.
Secondly, I see a sustained amount of productivity from weeks 14 to 22, followed by a drop and then several ebbs and flows. For example, the drops in week 24 and 25 correspond to some work travel and speaking at a conference as well as World Cup. Notably I also see a big drop in productivity around week 31 and 32. Those weeks correspond to an intentional break and vacation I took with some friends and trip to Tibet.
Breakdown of My “Time Sucks”
Following the steps from the last section, let’s create another pivot table to explore a few different time sucks in my life, like entertainment, social media and news sites.
Once again create a new pivot table, add row of year and values for the specific categories. Use sum for the results. And add a filter by year.
The end result should look something like this:

Once again create a chart to visualize the results:
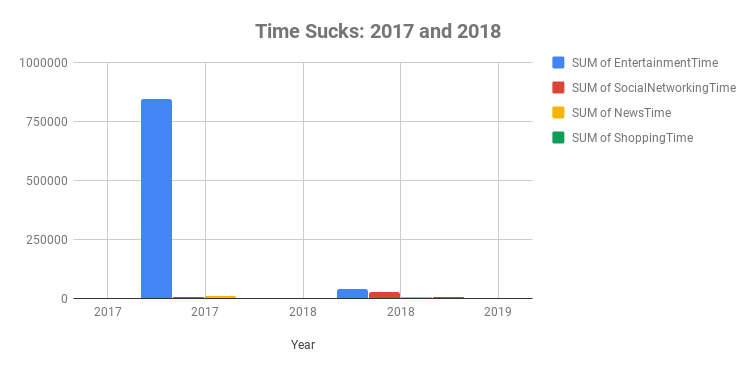
Once again we can see a lifestyle change I’ve made in the recent year or so to cut out entertainment and social media on my computer. Depending on your goals and objectives, a report like this could be a good way to keep a scoreboard on your distraction time too.
Breakdown of My Time Usage and Goals
Last but not least, let’s explore a few specific categories of my time tracking that correspond to certain goals in my life: writing and software development.
Once again create a pivot table using categories like SoftwareDevelopmentTime, DesignAndCompositionTime, ReferenceAndLearningTime, and BusinessTime. These categories correspond to where most of my time goes as well as my main focus for my targeted time usage. In my case, I’m using weeks for the row or dimension, and I’ve filtered this to just 2018.
The end result is a pretty clear pivot table of the amount of time I’m spending on different applications related to those areas, and it becomes easy to create any number of charts to visualize these treads:
![]()
While this chart isn’t the most beautiful and it might be more effective using just one or two data points, it’s quite illustrative of my time allotment this past year. I’ve also added trend lines using Linear Regression that help indicate the direction of my time usage too.
Conclusion: Power of Engaging with Your Data
In this post, we looked at time tracking using RescueTime. We then explored how to collect our daily summary data with IFTTT and Google Sheets. We added some code via Google App Scripts to parse human durations into Google Durations and finally a raw score of seconds spent. While some of the steps are a bit complex, the final setup should work going forward as new data is added daily. The result is a continuous stream of data that gets parsed and processed into a format we can use for our data analysis and data visualization.
![]()
We specifically looked at Google Sheets for our personal data analysis, but I encourage you to check out Google Data Studio or Tableau for more advanced tools. Beyond these simple examples there are lot of additional things you can do to optimize your time tracking dashboard in Google Sheets. But hopefully the steps I’ve laid out show you the key aspects of data collection and data processing you need.
Personally, I’m a big believer in the value of using data to better understand and improve our lives. While it’s a lot of fun to track different aspects of our lives, there is a big opportunity to be gained in engaging with your data. Using tracking and data you can better understand how to be more productive and healthier. You can leverage technology to be better organized and improve your memory. Ultimately it can lead you towards becoming data-driven!
Best of luck and happy tracking!
