2017 has been my year of tracking and personal data exploration. For the past year I’ve been meticulously tracking about 20 data points. Not only have I been tracking but I’ve been “optimizing” my life too.
As a followup to my Q2 check-in and as we head into the end of 2017, I wanted to share an update and attempt to dissect some of this tracking. Unlike my normal writing, this post is a mix of vinettes, i.e. observations and some of the things I’ve learned during my year of “tracking everything.”.
(NOTE: At the end of the post, I’ve included a full breakdown of what I’m currently tracking and the tech or process I use.)
Essential Health Biomarkers I Track
I’ve learned a lot about my health over the past couple years. This happened through a combination of more exercise and personal exploration of the health tracking and health analytics space.
On the exercise side, I transitioned from an overstressed and non-health-conscious techie to a life of relaxed and regular exercise and of good nutrition. This life transition is mostly tied to running my first marathon and run training in general. But when you push yourself to high performance in one area, it often requires adjustments in others to get you there.
This need for more health management is especially true for high performance sports and my health. Regular running revealed gaps in how I maintain my body and thus I had to add mobility exercises, better nutrition, sleep and supplements. You can’t go out a run for several hours a week on a weak body. So building up this foundation was key.
On the health tracking side, I’ve tried a number of experiment to monitor my body and health. So far, I’ve found these to be the best biomarkers to track:
Resting and Active Heart Rate (HR): I use a wearable to track my heart rate throughout the day and during exercise. Currently I’m able to see when my heart rate is outside of the normal ranges and realize I’m in stressed state or in need for rest. I think the tech and data management of HR will improve and become more actionable the years to come.
Heart Rate Variability: HRV is an extension of HR tracking. You are tracking the variance in your heart rate in order to understand the state of your central nervous system. When tracked each morning, your HRV trends can reveal your stress level and various factors that put you in a certain state. Personally I use this score to control how my stress, inflammation and life changes affect my overall quality of life.
Blood Biomarkers: I’m a big believer in using the biomarkers from blood testing to understand my health and wellness. By monitoring several key biomarkers you can understand how lifestyle changes and targeted interventions are improving your health. For example, following one specific blood test, I added a supplement and 6 months later I was able to recheck and see an improvement. In this way, you can think of your blood biomarkers as a scorecard on your baseline health.
Unlike HR or HRV, you don’t need to check your blood biomarkers every day. Instead since your blood is replenished ever 4 months, it makes sense to get your blood tested every few months or at least twice a year.
I don’t currently track my blood glucose or ketones, though it’s on my list to try one day, and I’ve heard some good things from fellow biohackers.
Beyond these core three areas, I also check my blood pressure once or twice a month. BP isn’t as important when we are younger and my numbers are good, but in view of how easy it is to track, I’ve added it to my health tracking routine. Hopefully it provides an alternative data point to cross check and confirm my other health data points.
In summary, the three essential biomarkers are check are: HR, HRV and Blood.
Completeness and the Unaccounted 28.3% of My Time
Time Tracking remains one of my favorite areas to track. In November I aggregated my time tracking into a simple table:
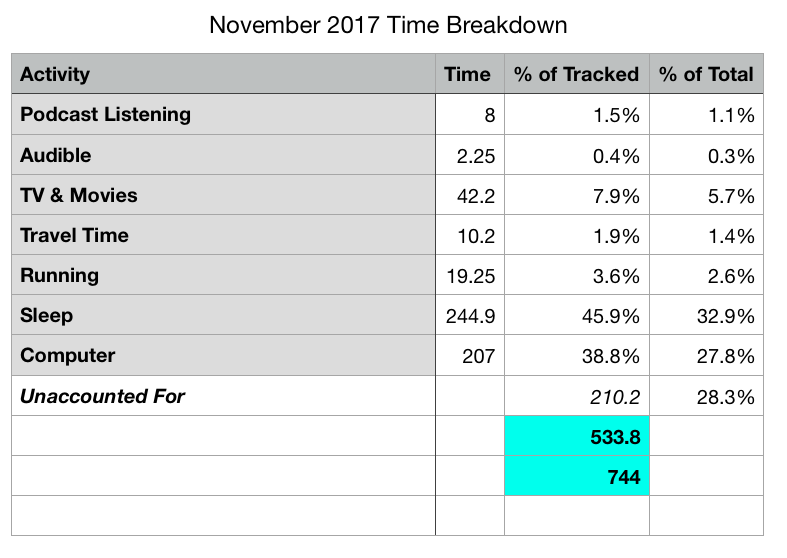
I tracked 533.8 out of a possible 744 hours in November. I was able to capture a record of 71.7% of my time.
This report doesn’t include my project time, which I manually track using Toggl. That accounted for 174h 48m. Nearly all of my project and personal work is done on the computer, which I track using using RescueTime. To put it another way 84.4% of my computer time is project time (174.8h / 207h).
This is a pretty high ratio of kickass time usage for me, and it means November was a rather productive month in terms of my time usage.
I mostly avoid manual tracking where possible. Fortunately, almost all of this time log was passively tracked. I have setup a system of tools that automatically collect the data. The two exceptions where I manually track my time and activity are: 1. TV and Movie Watching, which I log after watching a show or movie and takes about 20-30 seconds, and 2, Running, which I use a wearable to record when I start and finish a workout.
I’m happy with how complete a record I’m able to capture, but what about the unaccounted 28.3% of my time? What am I missing?
At present I don’t have a time log on a few keys, namely my book reading, my walking time, my mobile phone usage or my meal preparation and eating. Let’s look at these one by one.
I read with a Kindle, but unfortunately, Kindle doesn’t provide an easy way to know how much you read. So far, I’ve been unable to parse the system logs to come up with my kindle usage time. Ideally I could use the logs to interpret on and off time to gauge my reading time. The best option to estimate my monthly reading time would be to use my reading speed (pages per hour) and number of pages completed.
For walking time, I use an Apple Watch, which captures a ton of data points. Using my Apple Health logs, I should be able to extract my exercise minutes. This would be a pretty accurate assessment of my walking time and would be worth investigating.
I’m able to track my mobile phone usage on iOS. Unfortunately there is no report on Monthly Usage so it’s not included here. It wouldn’t be hard to get this number. I could either do an estimate of previous weeks or by exporting the data and running a specific analysis. I’m roughly spending 10-13 hours per week on my phone, so that means about 50 hours per month. My recent mobile phone usage is higher as I’ve been building a couple apps that require testing.
When it comes to cooking and eating, there are a few options for tracking. I could manually track this time, and I’ve experimented with this before. It’s annoying and I’m not a huge fan. I could also track a few meals and estimate the rest. If I eat out more often, I could study my Moves location tracking to know how long I spend in a restaurant. If I wanted to go another route, I could probably build a seat tracker to measure when I’m sitting at the dinner table. In all likely, I doubt I’ll specifically track my meal time, but I think it wouldn’t be hard to come up with a rough number.
What else is missing? Social time. Last month I specifically avoided much social time in order to focus on a few projects. This is likely why so much of my time was “capturable.” In reality, I normally have a smaller percentage of computer time and higher amount of social time. Probably the best way to capture this social time would be via my calendar. I do a decent job of logging my schedule and I could extract this to create a summary of the social component of my time.
All in all, slowly adding different tracking system have created a fairly complete portrait of my time. In order to improve the completeness of these logs, I’d be interested in gauging how much time I spend in social situations and see how that correlates with other aspects of my life.
Be Your Own Data Scientist: Personal Data, Quantified Self and Self-Tracking
One of my biggest lessons this past year is how we should think about self-tracking and the quantified self as extension of data science. As such, self-trackers need to position themselves as data scientists. We should equip themselves with the tools and mentality of data scientists.
For me, this has meant learning and using data visualization tools like Tableau and even going one step further with Python, R Programming and Machine Learning.
So far, I’ve only just begun to probe the possibilities around data science and self-tracking. For example, I’ve done a few experiments in data visualization with my tracking data:
I’m working a few visualization projects for year-in-review using D3.js and other tools too.
Data science has definitely gotten more popular in the last few years. There is still a lack of qualified data scientists and AI/ML experts too. I suspect we will see data science skills become a part of the educational curriculum. Increasingly technical skills mean working with data.
On the health data side, I think we are only at the beginning of leveraging all of this personal health data. Apple has one of the better data sets with steps and Heart Rate, and I’m thinking about how this data can be more useful and actionable.
The biggest challenge I think wouldn’t be the tracking, but the modeling. Can we use the data to make predictions? How can we use this health data and basic information about ourselves to model, predict and improve health outcomes?
This remains a big challenge, but one I expect to see great developments in the years to come.
PhotoStats.io: Tracking and Exploring My Photo Library
A couple months ago, I found a gap and opportunity in tracking my photos’ meta data. Basically our photos log a lot of extra information when we take photos. This info can be aggregated and hopefully analyzed to be interesting and meaningful.
Recently, I’ve been building a photo data tracking app to capture and explore this data. It’s called PhotoStats.io. The tool allows you to extract and store all of the metadata from the photos on your phone. We can use this data to help you visualize trends about your life using your photos. The ultimate goal is to use your photos and their connected data to tell a story.
If you are interested, check out PhotoStats.io to learn more or download it on either iOS and Android.
Focus on the Metrics That Matter the Most
The list of metrics we can possibly track is endless. Many of them are not that useful too. So it’s important to focus on key metrics that can have impact on your life.
When it comes to health and wellness, I’d argue that there are a few biomarkers that are particularly important. These include Heart Rate Variability, Resting Heart Rate, Blood Glucose, and Blood (Testing) Biomarkers.
For productivity, you can largely capture key metrics through passive tracking and leverage a few solid productivity tools. Whether you track your time, how many tasks you complete or progress on your projects or goals, it’s important to find a “number” that reflects how you are doing in you work and creative life.
Depending on your personal goals or hobbies, you should consider a way to measure yourself in those too. I’m a runner, so I track my runs and use a smart training system to measure my improvements. Similarly I keep a list of my long-term goals and projects in order to know if I’m making progress or not there too.
Track Areas that Tell a Story
This past year I’ve realized how much I enjoy tracking and visualizing the media I consume. So far, I track my movies and TV shows, log my music listening, and record what podcasts I hear. I also check-in what books I read and try to keep a log of the articles I read too.
This might appear to be quite an effort to track, but actually it’s not; it’s just a habit. When I start a book, I note it in GoodReads, and when I finish that book, I note it again. Similarly, when I finish a TV show or movie I log it too.
Tracking my podcast listening is not quite as easy as I’d like it. My current technique is to just take a screenshot of the episode and then manual log it into my Podcast Tracker service after. This works for now, but I hope to make this more seamless going forward. Most likely by create an app to log and listen to podcasts.
Ultimately there are two aspects that I particularly like about tracking my media. First, I enjoy visualizing and explore the data itself. I can show patterns and see behaviors.
Second, it’s great to have a rich digital memory. I know all the media I’ve touch, including when I consumed it and often times my rating, feeling or thoughts about it. This makes it easy to make connections and re-read something that I want to recall later.
No Limit to Passive Tracking
I recommend using any and all passive tracking tools. If something can be tracking passively and without much friction in your life, you really should track it. Even though these data points might not be as high impact as others, it doesn’t hurt to have an extra data point later for comparison and data analysis.
Here are some examples of areas that can be passively tracked: heart rate, steps, location, daily stand up’s, movements (car, public transportation, cycling, planes), mobile phone usage, photo metadata, finances, sleep, words typed, and music listening.
While it may not seem important to track all of these areas, it often only takes a few minutes to set up your tracking. Once you do, you’ll already be collecting data, and if you don’t, in most cases, it’s impossible to retroactively get this data later. (Maybe the one exception is tracking your photo’s metadata, which you can extract later.)
Limit Manual Tracking to High Impact Metrics
In general you should avoid manual tracking and use passive, background tracking techniques. Manual tracking takes extra effort and time, and this leads to a great chance of not being consistent in your tracking.
There are a few instances where manual tracking is unavoidable if you want to measure a certain area. This includes several important health metrics like HRV, Blood Pressure and Blood Tests. Fortunately only HRV requires regular check-ins. By contrast, you can get away with intermittent tracking for your blood pressure and once or twice a year blood tests.
When it comes to manual tracking, you need to be more conscious about what you are tracking and why. For example, if you want to improve your eating and nutrition, then food tracking is a great approach. You can log your food to get a baseline idea of your caloric intake, and then use that to tweak how you eat. Subsequently you can re-track your food to see if those changes are working.
Manual tracking is mostly done during shorter experiments. You initially track something for a couple weeks and then look at the data to discover trends. Based on your analysis, you can start an intervention and re-track that area to see if it works.
Conclusion: My Current Track Tech and Habits
Here is a list of everything I currently use to track my life:
Time and Productivity
- Project Time: With Toggl, I manually log any time I spend on work projects, startup work, studies, creative work and a few other areas.
- Computer Time: I track my computer time and productivity with RescueTime.
- Tasks: I track tasks with Todoist.
I use these three data points in my Data-Driven Weekly Reviews in order to calculate how productive I was and if I was on task.
Checkout this post for a (slightly older, though still relevant) review of time tracking tools
Health and Wellness
- Heart Rate Variability: I use the app HRV4Training to collect my morning reading daily. (NOTE: This app also lets me log a few contextual data points like sickness, drinking, perceived fatigue, and if I’m traveling)
- Resting & Active Heart Rate: Logged with Apple Watch. I’m still looking for a way to better understand my HR trends.
- Sleep: AutoSleep using Apple Watch
- Blood Biomarkers: I use several blood testing services and log my results in a spreadsheet.
- Blood Pressure: I got a simple at-home device for blood pressure tests that I log to an app and aggregate in Apple Health.
Fitness and Sports
- Strava on Apple Watch: Tool I use to log my runs which captures GPS, Distance, Pace, and active Heart Rate
- SportTracks: Aggregates my running workouts and provides some nice ways to explore the data.
- TrainAsOne: This is the tool I use for generated a Data-Driven Run Training Plan. It pulls in data from Strava and generates appropriate workouts for my goals and current fitness level.
- Mobility and Stretching: I use Apple’s Workflow app to log simple stretching sessions into Apple Health. I use Zones app to get my weekly totals.
Places and Movements
- Steps on Apple Watch: Passively tracks how many steps I take per day.
- Places and Movements: Moves App logs all the places I visit and how I got there (walking, driving, airplane, etc)
Habit Tracking
- Daily Morning Routine Habits, like taking vitamins and supplements: Logged with Productive App
- Key Regularly Habits: Logged with Streaks app on iPhone and Apple Watch
- WordCounter for Mac: Tracks how many words I type
- Morning Pages and Journaling with Day One