
QS Ledger
Overview
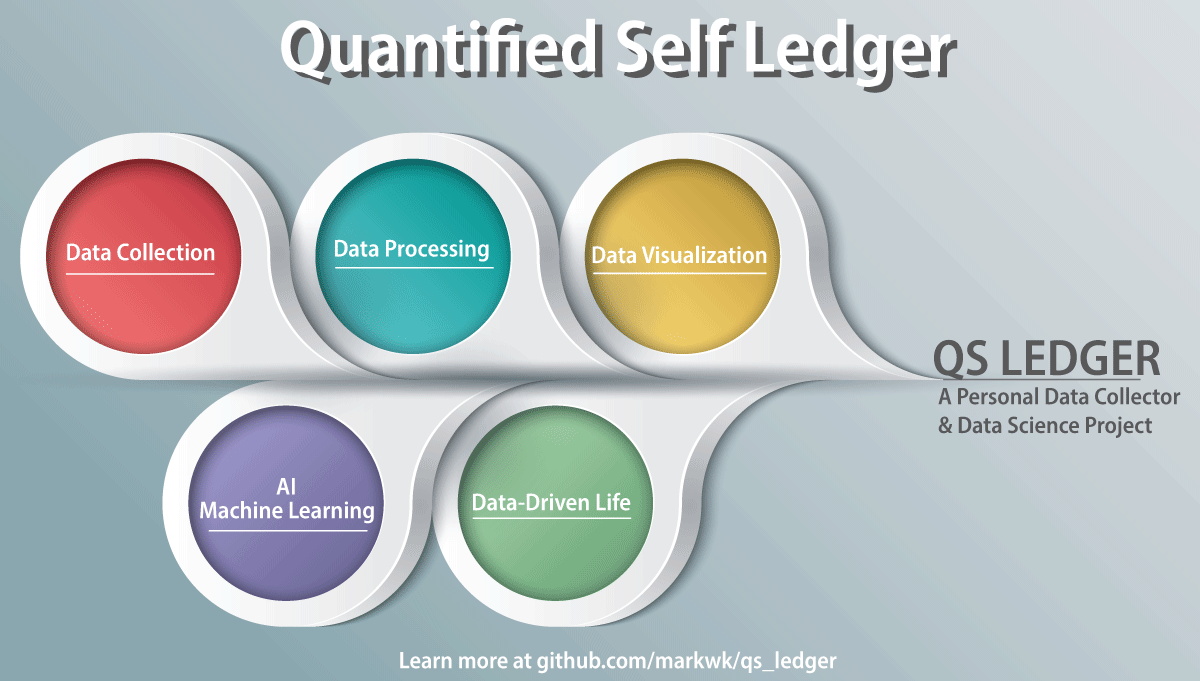
QS Ledger is an open-source collection of Python scripts and Jupyter notebooks for pulling your personal data out of the apps and devices that hold it, then cleaning, combining, and visualizing it. I built it to answer my own questions about how I spend my time, what I read, and how I sleep and move. It grew into one of the more widely used personal data toolkits on GitHub, with over 1,000 stars and nearly 200 forks.
The idea behind it: give me my data, then help me tell a story with it. More in the intro post.
The Problem
Personal data is scattered across dozens of services, each with its own API, export format, and limits. The apps hand you their summary and their answer. Asking your own questions across all of it, like whether reading goes up when screen time goes down, was close to impossible without writing a lot of glue code.
What It Does
- Collectors for 15+ sources: Apple Health, Fitbit, Oura, Strava, RescueTime, Toggl, Todoist, Habitica, Google Calendar, Google Sheets, Goodreads, Kindle, Instapaper, Pocket, Last.fm, and a word counter for writing
- Notebooks for each source that clean the data and walk through a first round of analysis and charts
- Cross-source analysis notebooks for looking at patterns across different parts of life
- Local and private: everything runs on your own machine, with your own API keys
In Use: My Year in Data
QS Ledger became the backbone of my yearly reviews on this blog: time, reading, creativity, and other data. A couple of examples:
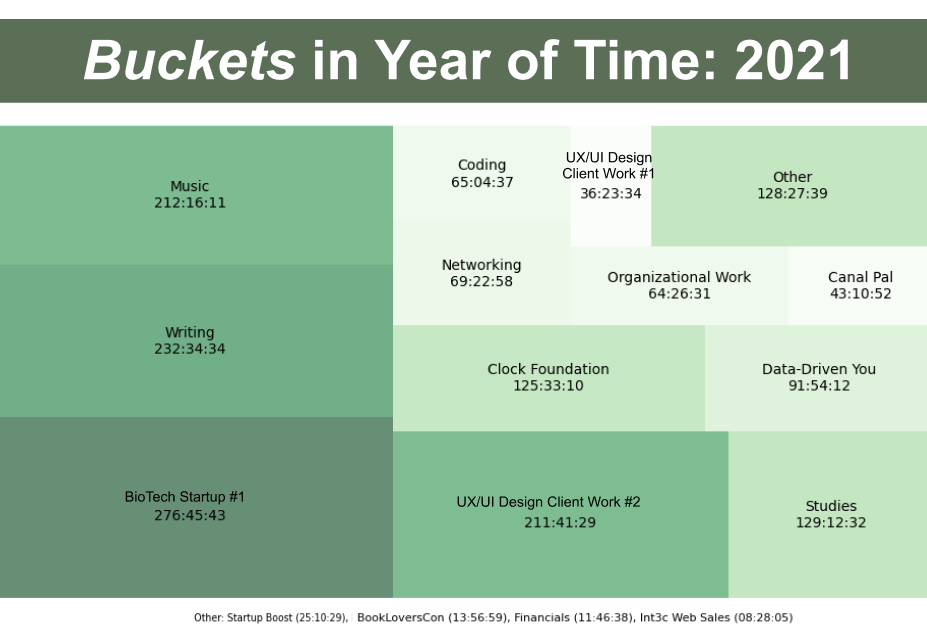
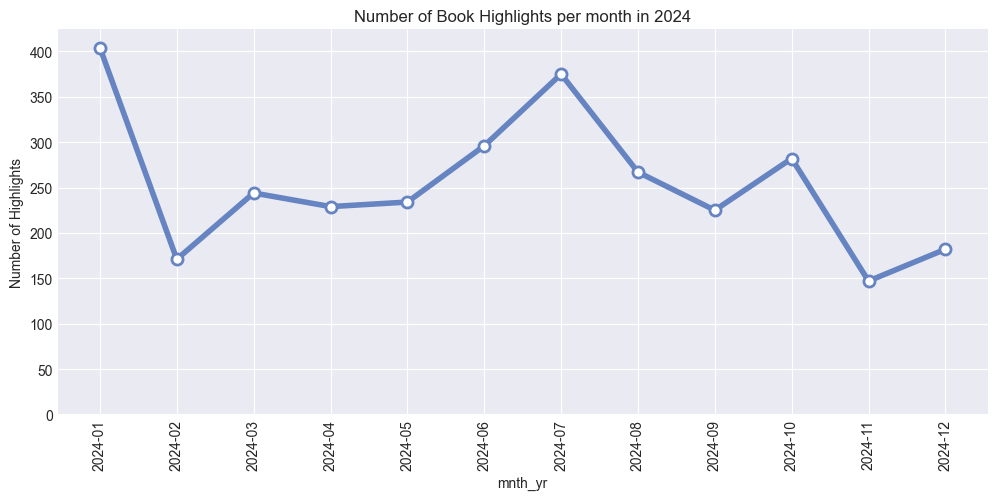
See more in the 2021 year in time, 2024 year in reading, and 2024 year in time posts.
What I Learned
- The value is in the questions, not the dashboard. The best insights came from asking something specific of my own data, not from a generic summary.
- Open source travels. People forked it to track things I never would have, and their questions made the project better.
- Collection is the hard part. Most of the work, and most of the breakage, lives in getting data out of each service as APIs change.
Tech Stack
- Python
- Pandas
- Jupyter Notebooks
- APIs
- Data Visualization