2017 was a year of self-tracking and personal data. So inspired by all the data I collected and some new found abilities in data visualizations, here is my year in data
(NOTE: Lessons learned from all of this tracking will be covered in separate post. My formal annual review will also be in a unique post.)
Let’s look at my past year… in data.
A Year in Data
I set 20 areas to track in 2017. Only two of which I dropped (meditation tracking and body temperature tracking).
Here are few areas that I tracked in 2017, and the data discovery I’ve gained from that tracking.
Getting Things Done: My Year in Tasks and Projects
This was my first full year using Todoist as my primary “getting things done” productivity tool. Not only did todoist help me stay organized and manage a lot of tasks and projects, I was able to track my tasks. Using this dataK I can see my year in tasks:

It’s noteworthy that in my second half of the year, I got even more tasks done than the first, meaning I both found projects and pursuits that excited me and had great time management to get them done.
More Productive Time Usage in 2017
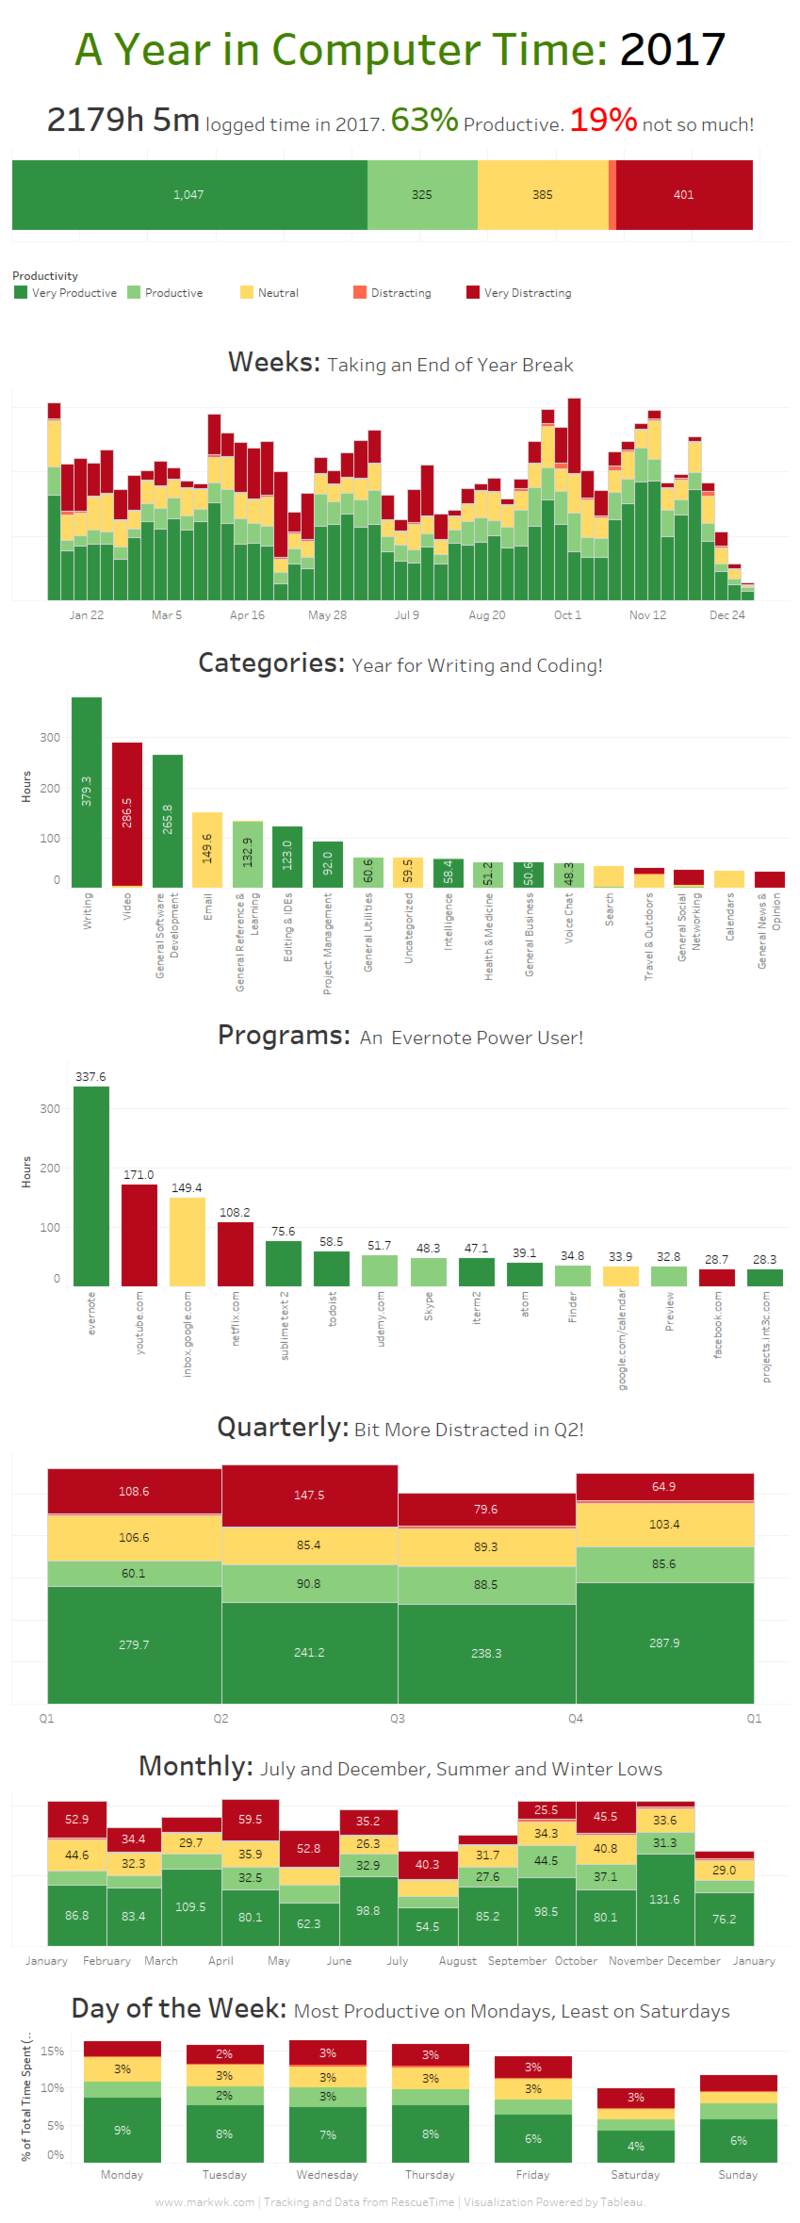
I continue to strive to remove distractions from my work life and avoid anything unnecessary in pursuit of my objectives. Using my RescueTime data, I can see various trends throughout the year, but most positively I was able to get more productive and less distracted as the year progressed.
At the end of the year, you can see that I took a break. So the last 10 days or so of December were an almost complete digital detox. I like the idea of working hard and taking fuller breaks. It’s something I plan to strive to continue going forward.
Beyond Passive Time Logging: My Project Time
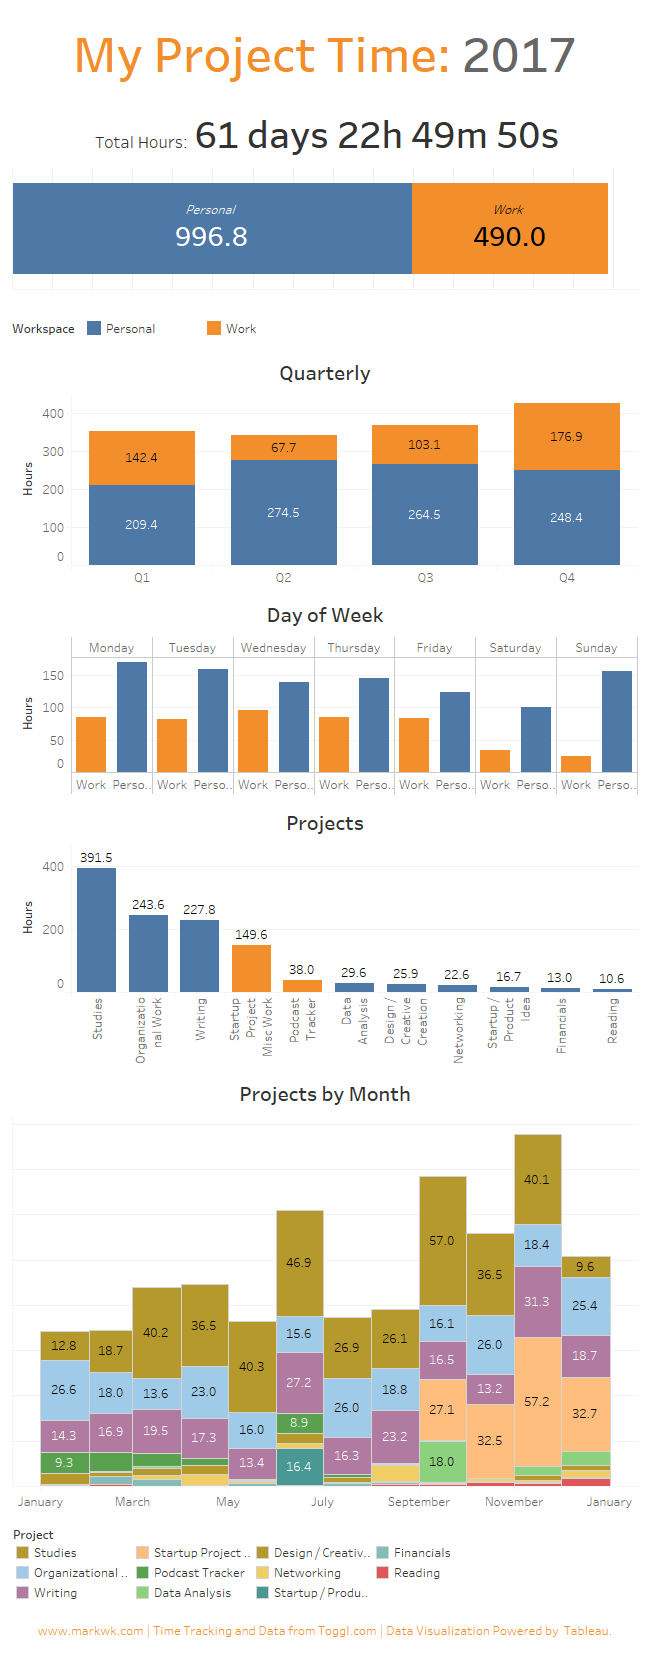
While I’m a huge fan of passive time tracking with RescueTime, I also find that manual time tracking really helps me too. It’s a conscious act to focus on some project or group of related tasks. I use Toggl to manually track where my time went each week. Here’s what my 2017 looked like in terms of project time:
According to my kickass ratio of time usage, I scored a 68.2% for all 2017.
Oh Email…
With all of the data I have now, I’m able to dig into specific area of my life with focused questions. Recently I was thinking (again!) about how to improve my email usage and decrease how often I check my email. In order to understand this question, I pulled out my data to see how I checked my email on my computer last year.

Most days I check my email on 9 hours of the day, and there were even some days where I checked my email 15 hours out of 24. That’s a lot.
This is definitely an area I’m going to be watching going forward, and hopefully now that I have a dashboard setup I can become more conscious about how to manage my email checking “addiction.”
(Alternatively, checkout my data exploration of facebook check-ins.)
Year of Running: 2 Marathons, 2 Half Marathons and a Speedy 5k
Continuing on a habit I started in 2016, 2017 was a year of running for me. I managed to finish my first marathon in March, and I continued training through the rest of the year to complete a total of two marathons, two half-marathons and a speedy 5k in San Francisco.
In late December, I was happy to complete my second ever marathon for a time of 4:07 and a significant improvement over my first one.
Here’s what my year of running looked like in data:
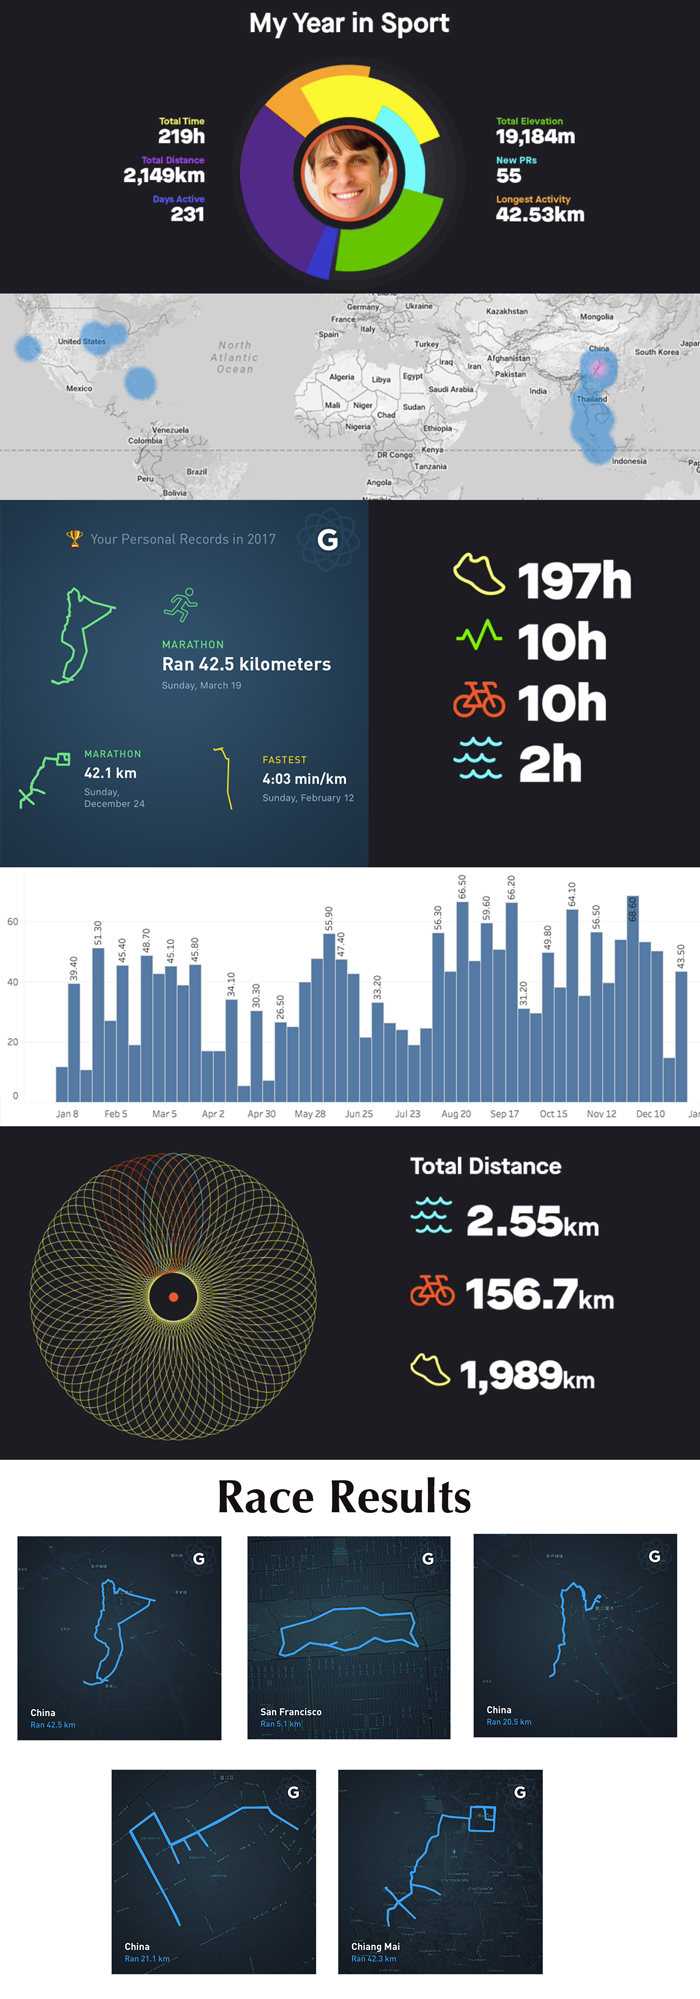
There is definitely more to be explored in my fitness data, but these are nice high-level stats and stories. For the year to come, I’ve already signed up for a repeat of my first marathon in March 2018. I’m hoping for another fun time, a great effort to get there, and maybe even a sub-4h completion.
My Favorite Biomarker: HRV
This past year I’ve gotten into various health metrics and biomarkers. This includes blood biomarkers, blood pressure and various other ways to quantify the body and my health.
My favorite measurement remains Heart Rate Variability, which is a way to measure bodily stress and what affects it.
Here is a portrait of my HRV data trends from the past year:
Along with a slight overall improvement in my HRV (and VO2 Max), I’ve regular measured my HRV with contextual data, and I discovered a solid correlation between travel, high intensity workouts or alcohol and decreased HRV (i.e. increased stressed). So increased travel or drinking come with increased stress.
While I’m not going to stop drinking, traveling or high intensity workouts, I have a better sense about how these and other factors (like air quality or air conditioning) affect my health.
I’m looking forward to continuing to explore other health biomarkers in the coming year and hope to have more to report on soon.
Another Year of Book Reading:
Beyond productivity and health tracking, I also enjoy tracking media too. This means books, articles, music and even podcast tracking.
Here is what my year in book reading looked like.

While I managed to capture the articles I read, I don’t have a great list of the aggregated data. Hopefully I can fix that in 2018, and I can manage some simple natural language processing to parse out summaries of what I read.
Similarly, this past year I tracked my podcast listening. The tool I built is available at podcastracker.com. Contact me if you are interested in using it. I’m still working on my data processing and visualization about my podcast listening in 2017, which I hope to share more on soon too.
Oh Steps…
Like a lot of folks my journey into self-tracking started with a pedometer. I don’t find my daily steps metric all that useful or meaningful, especially compared to heart rate or sleep data. I also find the Apple Watch contextual notifications about lack of movement and standing up to be good cue too.
That said, I did my fair share of foot movement in 2017:
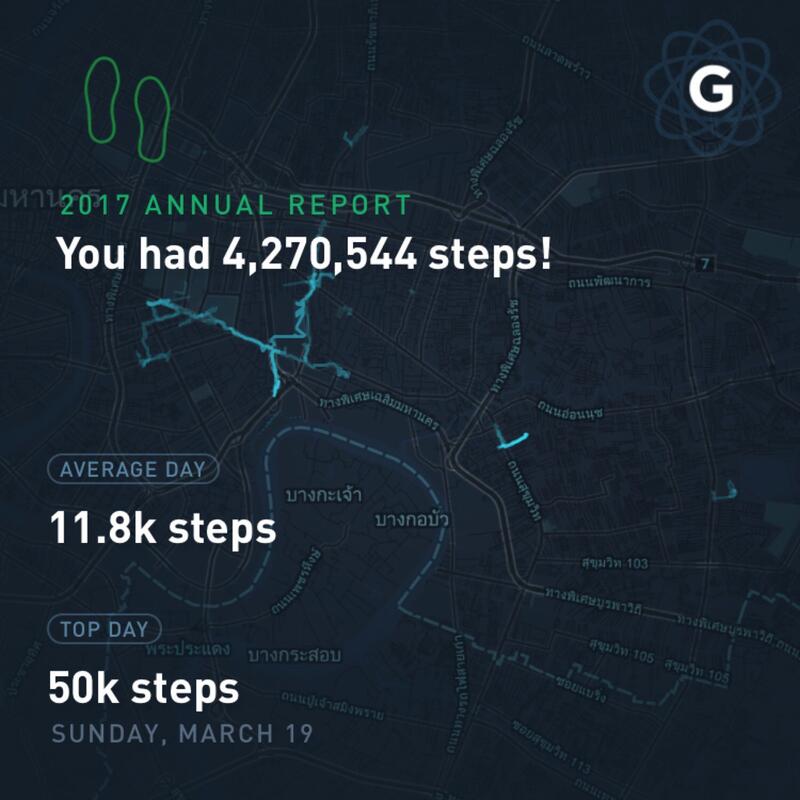
I definitely hit my 10,000 steps per day.
Lost Weight
Now that I run a lot and go to the gym regularly, I don’t particularly obsess about what I eat. I try to eat enough, and when I’m not traveling, I eat a balanced diet of low meat and lots of fruits and vegetables.
Checking my scale, it turns out I lost 2.8 kilos (6.1 pounds) in 2017.
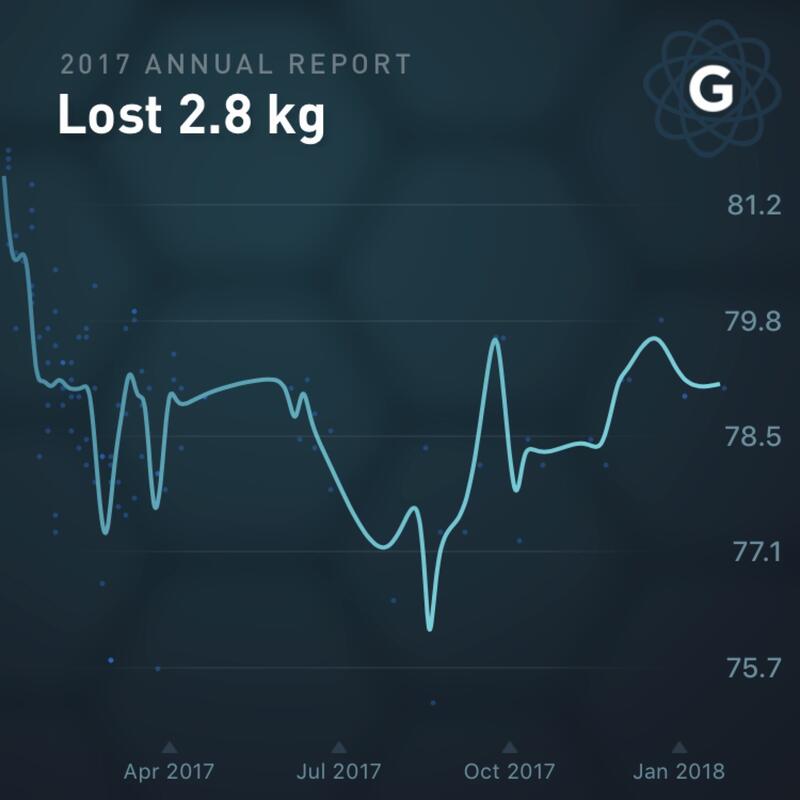
Currently my goal isn’t to lose much more weight. Instead, my target is body recomposition. Less fat and more muscle.
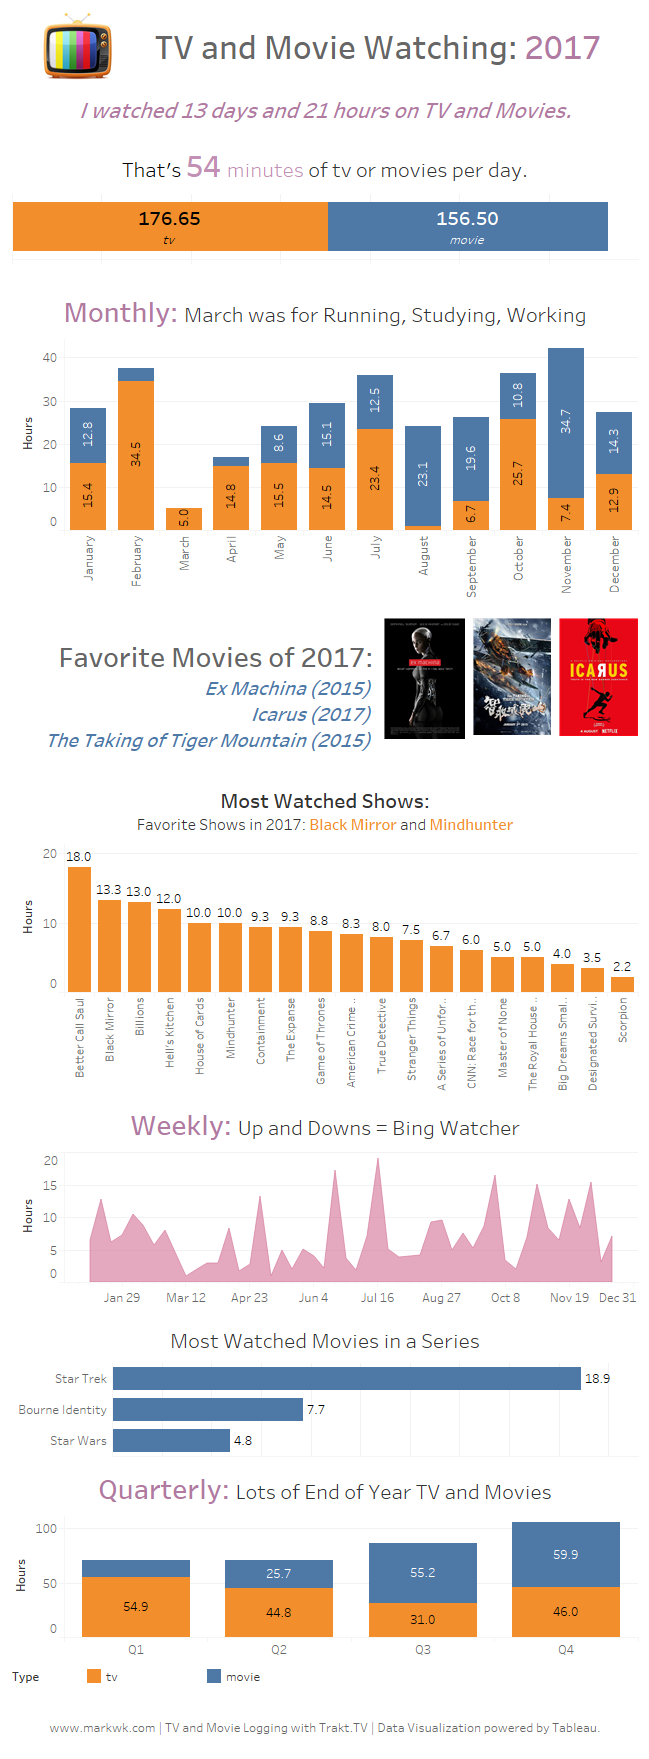
TV and Movie Watching
Conclusion: A Year in Numbers
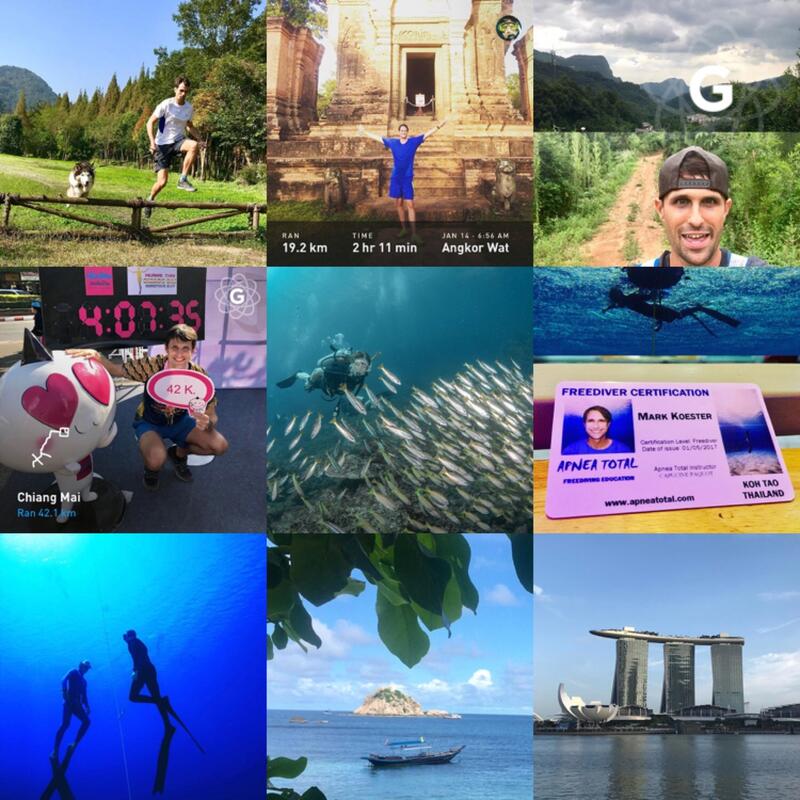
2017 was an interesting year for me, and numbers can’t exactly catch it all. Number do tell an interesting story and open unique ways to retell a year or remind you about how a year went.
Here are my “big” numbers from 2017:
- 38 blog posts published
- 1989 kilometers (1,236 miles) run
- 199 photos posted
- 90.8 days on computer
- 4.2 millions steps
- 61.9 days on projects
- 2 completed 42.2 km marathons
- 2137 completed tasks on 33 projects
- 21,000 book pages read
How was your last year? What was your year like in numbers?

