475.
That is roughly the number of photos that was taken by each smart phone user in 2017. That’s a lot of photos. That’s a lot of data.
But with this photo data, what insights and learnings are we able to get from our photos?
The photos on your mobile phone are one of the richest collections of data you have on yourself. If you regularly take photos with your phone (which most of us do), then your phone is collecting data on you.
Or to put it a more positive way, when you take photos, you also collect some additional data like where you were, what time and certain conditions at the time of the photo taking event.
Unfortunately, we aren’t leveraging our photo data to understand ourselves and our behaviors. While photo backup services might use our photo data, most actually strip the metadata on our photos and we lose it forever.
Fortunately there is a solution to start tracking, recording and leveraging your photo’s metadata. Using a new app called PhotoStats.io, you can are able to backup your photo metadata on your phone and, in turn, start leveraging it to understand a piece of data about your life.
In this post, I want to explore, visualize and start to understand my photo data. First, I want to share how to collect your metadata on your photos. We will get all of the metadata on your phone’s photos using an app called PhotoStats. Second, we will look into the information we can glean off that data as well as create a few simple visualizations and infographics. We will conclude with a bit of initial data exploration and visualization and some further areas for future research.
Self and Selfies in a World of Photos:
475 photos per smart phone user per year
We take photos a lot. In 2000, Kodak announced that 80 billion photos had been taken that year, setting a new record, according to an article on digital photography numbers in the New York Times. That number seems quaint as 2017 was estimated at 1.3 trillion photos taken.
The vast majority (over 85%) are taken by a smart phone or tablet. That translates to about 475 photos per smart phone user per year.
(According to the United Nations, the world population is estimated to have reached 7.6 billion as of October 2017. According to Statista, “The number of smartphone users is forecast to grow from 2.1 billion in 2016 to around 2.5 billion in 2019, with smartphone penetration rates increasing as well. Just over 36 percent of the world’s population is projected to use a smartphone by 2018, up from about 10 percent in 2011.” As such, we can estimate roughly 2.7 billion smart phone users for 2017, and conclude divide 1.3 trillion photos by that number to reach 475 photos per user in 2017.)
The underlying data attached to your photos is called the metadata. It’s the “extra” data attached to the primary data, which is the photo itself.
For example, when you take a photo, you not only record the image itself but you also record data on where you took it, what direction you were point, your altitude and tons of other bits of technical data too.
You can can learn a lot from this data, and, I’d go so far as to argue that our photos are one of the richest and most available data sets we have on humans today.
Data analysis, machine learning, and computer vision are all creating a huge opportunity to derive insight from the visual aspect of the photos we take. Similarly just looking at the metadata, we can learn patterns about places you go, whether you are taking pictures of certain scenes or people, taking photos at night, in the afternoon, the day time, while moving, and much, much more.
But before you can start using and looking at your photo data, you need to collect it.
How to Collect the Metadata from Your Phone’s Photos
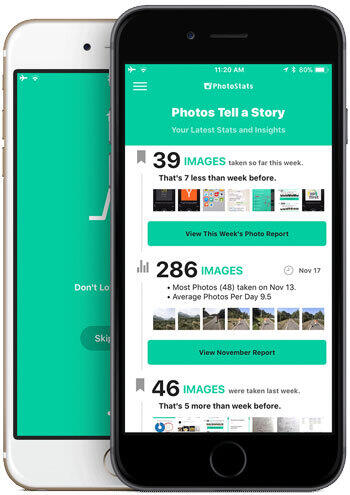
There are a few ways you can collect the metadata from your photos.
Unfortunately, most are quite technically demanding. For example, you’ll first need to store the photos on your computer and then you can use an open source library like EXIF Tool to extract metadata from all of your photos. Fortunately there is a better way that can be done directly from your smart phone, which allows you to extract this data more often and also get some initial insights too.
For the past couple month, I’ve been building a photo tracking app called PhotoStats.io. The app’s main purpose is to track all of the metadata about the photos on your phone. This means the data for your current photos as well as storing and aggregating that data across time, different phones and even after photos are deleted. It’s a way to keep a record of your own meta data forever.
Once you have your data extracted, you can either use PhotoStats app to explore that data or, after exporting your data (as CSV or JSON), you can do some data analysis in other tools.
Right now PhotoStats app’s data visualization and analysis features are simple. Currently you can look at the average number of photo taking during different time periods. We are working on additional reports, visualizations, and maps and hopefully one day adding machine learning to model this data better.
At its core, Photo Stats app is for anyone interested in the quantified self, personal data and self-tracking as well as for anyone who just wants to know more about their photos and themselves too.
PhotoStats app is in full development, and we’ve released a public version for both iOS and Android. Learn more at www.photostats.io or download the current version of this Photo Metadata Tracker now.
To use the app, just download and install the latest version. Then start the app. After providing access permissions to your photo library, run the initial process that will extract all the metadata. This process may take a few minutes depending on how many photos you have. For now, this data is stored locally and privately and not shared outside the application.
Initial Data Exploration of Photo Data with PhotoStats.io and Google Sheets
All data and tracking projects start with an initial stage of data exploration. You are trying to get a sense of the data, what’s there and some rough meaning around it.
There are various ways and tools you can use for initial data analysis. Personally, I use R Programming and Tableau for most of my data science work, but in this situation, you can easily use a simple spreadsheet app too.
Let’s look at our Photo data in Google Sheets.
![]()
The first thing you’ll notice is that there are a lot of columns of data. Whether you realize it or not, your photos contain a lot of contextual information. This includes not only basic file info like name, type and size, but also temporal data about when taken, edited, etc. as well as locational data on where. Furthermore most of your files contain additional technical info on the camera settings when you took the photo.
All combined you should have almost 200 columns of data on each of your photos. Not all of your photos contain full metadata. For example, since they aren’t taken using a camera, screenshots only contain basic data and do not include locational and various metadata on the camera settings.
One important aspect of data science and data analysis is data visualization. At its most basic, data visualization stands for the ability to convey a story or an idea as efficiently as possible. Quite simply data visualization helps you to identify patterns, disruptions and trends in data.
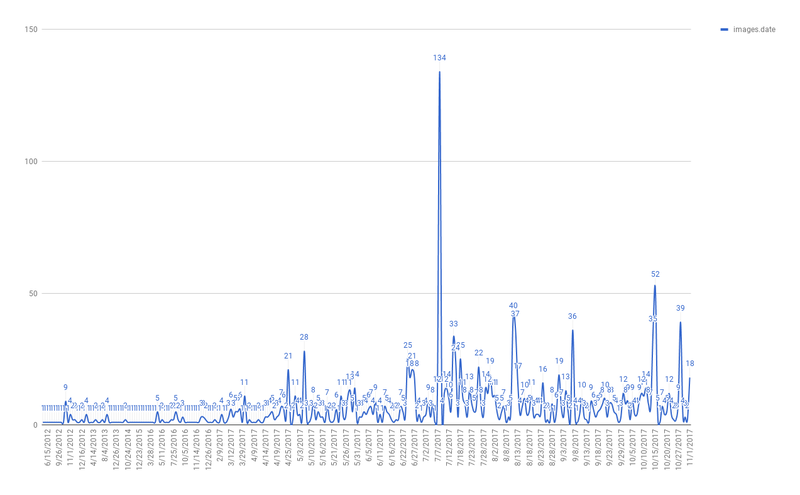
Data visualization is also a way to explore your data. With Google Sheets, I created a line chart of my photos per day:
For my purposes, I highlighted several notable columns in red and created pie charts showing the breakdown of different aspects of my photos:
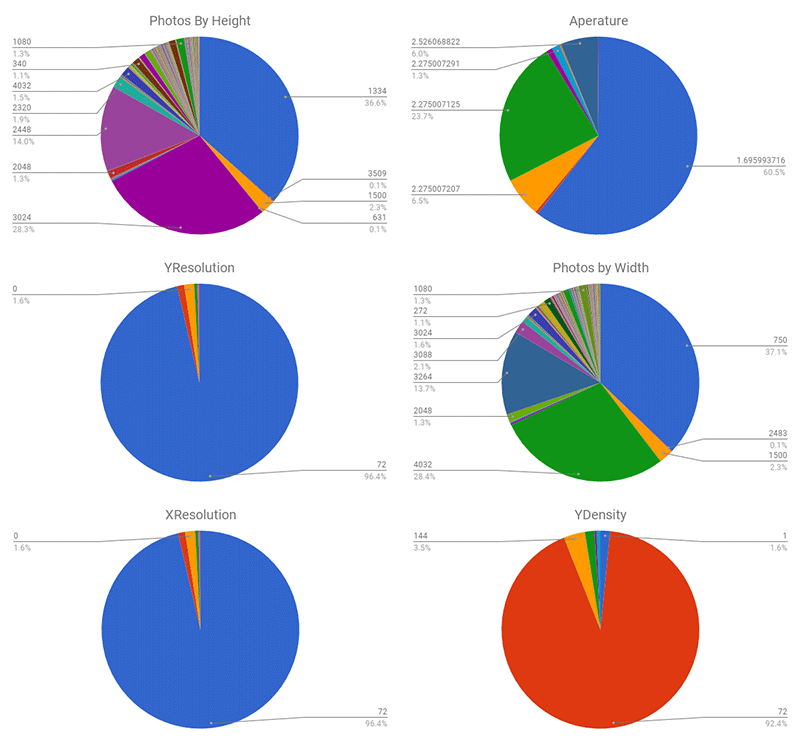
These are just a few examples of the breakdown of my photos. None of these visualizations are particularly beautiful or noteworthy, but it does work to give you a few ideas about your photo taking.
One particular gap in this data analysis is the locational data. Google Sheets is not setup to process the longitude/latitude data into analysis. So you’ll need to use another tool, like MapBox which we will look at below.
Overall, the most important takeaway from this initial exploration on my photo data is that there is a lot of it. The meaning of some of it is fairly obvious, while others needs further refinement. Let’s look at some of these data points in more detail first using with PhotoStats app.
Aggregate Numbers: How Many Photos Are You Taking and when?
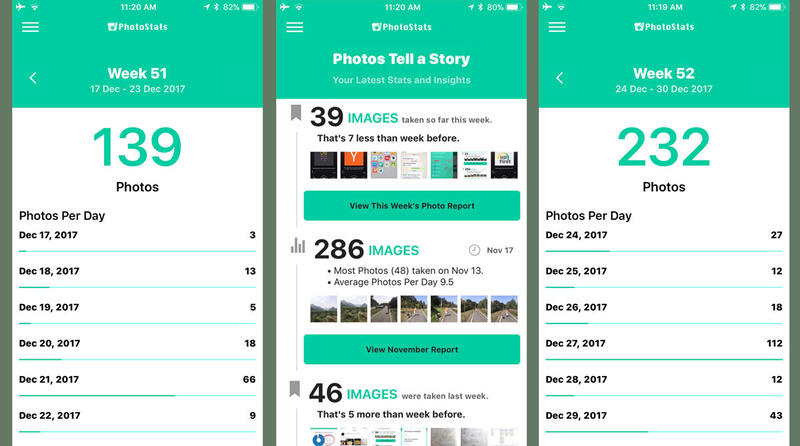
Currently, PhotoStats’ initial reports are focused on tracking how many photos you taking and where. As a tool for quantified self-trackers and life loggers, the app helps record and store all of your photos’ metadata.
Beyond the tracking, there are several reports you can use to explore your data and, of course, you can also export the data to explore yourself.
Whether you got your metadata from PhotoStats or by manually extracting, one of the most obvious initial ways to look at the data is how many and during which periods.
Here is a D3.js Visualization of my photos taken since late June 2017, which is when I bought a new iPhone 7 and was primarily traveling:
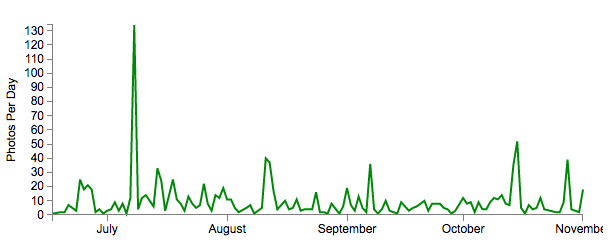
The first thing I noticed from these stats is that I’m taking more photos than the global average per smart phone user of 1.3 per day.
When I think of myself and some friends who clearly take a lot of photos, I also wonder if the global photo estimate statistic is correct. I don’t even consider myself particularly addicted to taking photos. My guess is that we might be underestimating the number of photos being taken around the world today.
Hopefully on-going usage of an app like PhotoStats.io will help me see how many I’m taking as well as help us better estimate global trends.
Peak Photo Days Mean Something
One other thing I personally noticed in pooling my photos was that I took more photos on certain days. Once I visualized the data it became obvious that I might take three or four photos per day on most day, but at other times I’m taking 20 or more photos in a day. There even several days where I took upwards of 40 to 100 photos. Something happened on these days that lead to more photos.
Looking more closely I realized that most “peak” photo days involved a few scenarios: holidays, family gatherings or great weather. In my case, one 134-photo day correlated with a great weather day while in the Bahamas and several others were great weather days on runs or at the park or a touristy day somewhere.
It’s obvious that we may not take photos everyday but when we do, there is a strong chance it means something.
This is an area for further exploration, but I’d hypothesize our photo data may not be just meaningful in its aggregate, but also that peak increases signify that something unique is happening and worth highlighting. These peak periods could be meaningfully visualized as a single day or few days of data too.
I take a lot of screenshots.
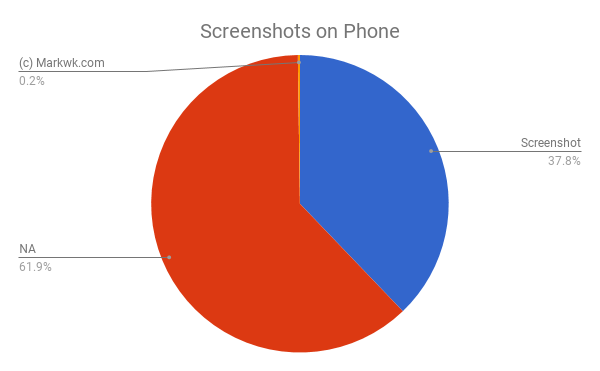
This visualization isn’t yet available on the app, but using the export, I created a simple pie chart of the comments on photos. I honestly didn’t even realize that photos have comments and that Apple iPhone photos attach a comment of “Screenshot” when you take one. This means it possible to calculate the breakdown of true camera photos vs. screenshots.
About 38% of my photos are screenshots, which I’d guess is more than most smart phone photographers, though this is also an area for further analysis.
Why so many screenshots? As a mobile and web developer, I use screenshots in my work. This is how we spot problems and share back what we see.
As a self-tracker, I also use screenshots to track different aspects of my life. For example, I track my podcast listening by simply taking a screenshot of the episode, which I then log into my podcast tracker. This leads to a ton of screenshots.
Even without looking at my podcast listening logs, I can use this screenshot number to quickly see periods of increased podcast listening. For others, screenshots might represent app development. I have yet to analysis the data, but knowing this breakdown exists makes me wonder what I might find in the clustering of screenshots on certain days and hours.
Locations and Mapping Your Photos
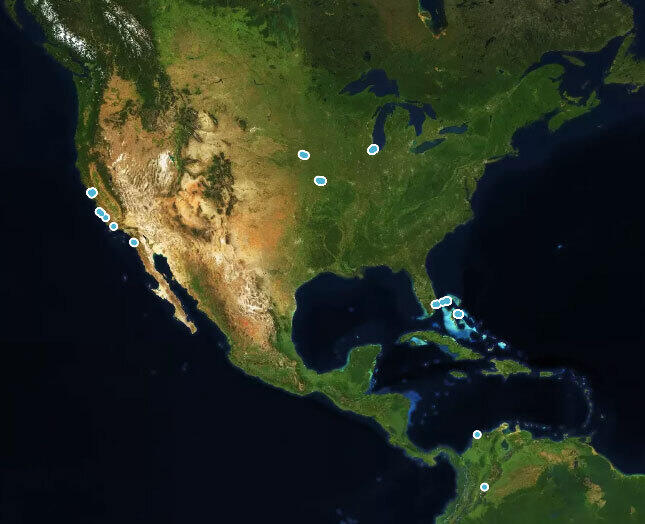
One of the most underutilized aspects of our photos is the locational data. If you have enabled GPS with your camera, then your photos should all have location data. This can be both a great thing for tracking and personal data, but it is also a potential privacy concern.
Your photos’ location data is awesome, because that GPS can be used to create maps of where you were and even help you retrace your steps on a trip or a special day.
I’m a huge fan of location tracking. I use a service called Moves to constantly track my location and movements. I have integrated my location data with my calendar to create a display of both where I am and what I am doing (meetings, events, tasks, etc.). For more on this, see my post, Calendar as a Self-Tracking Tool.
With your photos you can get a lot of the same benefits as constant location tracking without the hassle of an additional app and its battery usage.
Here is a map I built using MapBox to visualize my photos from a few recent trips around Europe:
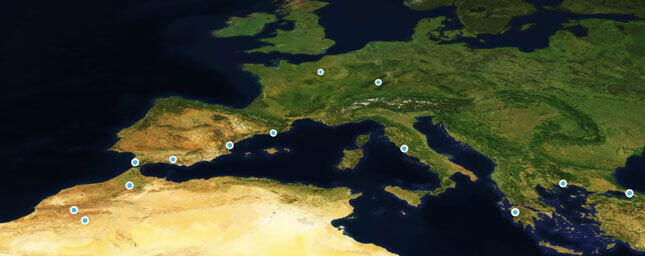
With photo data, you can see interesting visualizations of your movements since photos contain heading and even speed.
One occasional usage for my photos is remembering where I parked. On an early morning race, I had to park a few kilometers from the start. It was early and dark. So, as I jogged to the starting point, I quickly took a photo of the area. Afterwards, I used my photos’ location to find out where I parked a car.
The problem with location data on photos is privacy. Every app that you provide access to your photo library has access to your location data. I don’t disagree that this location data can be useful in my cases and makes for interesting social media posts of where you were. But the question is whether or not these various apps should have or even need access to your entire location history along with the photo itself?
Privacy concerns are outside the scope of this post, but in my opinion, this issue could be ameliorated by separating the permission that provides access to a photo from the permission that provides access to the locational data. We could, for example, split up these two permissions.
Your photos’ location data is incredibly rich and detailed. Various apps like PhotoStats.io help you explore that data in space, and it is definitely an area for more feature work.
If you wish to explore your photos’ location in maps on your own, one powerful and relatively easy to use tool is MapBox. You simply need to export your data and do a bit of cleanup before importing it into MapBox as a dataset. Then add tiles and styles to create a map of your photos.
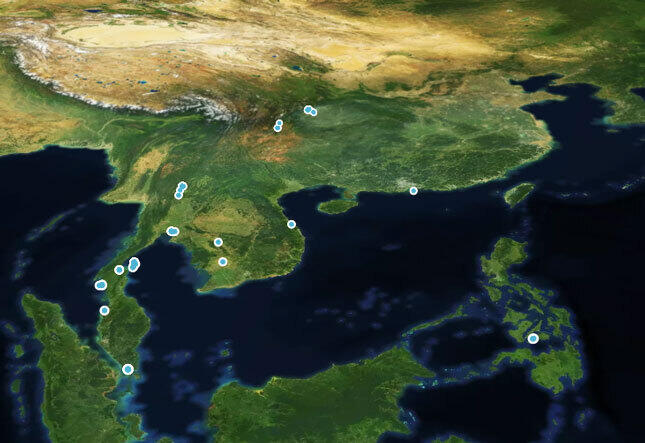
In this section I included a few quick examples of mapping visualization using MapBox from my photo data.
EXIF: Your Photos’ Technical Data
Metadata Collected with PhotoStats.io. Visualization powered by d3-pie.
Along with when and where, most of your photos also contain a special type of metadata called EXIF. EXIF stands for “exchangeable image file format,” and it is a standard kind of data on digital image files. At its most basic EXIF represents the various situation conditions when you took the photos.
EXIF contains a lot of fields of data. With PhotoStats’ full export, you get over 200 columns of EXIF data on your photos. In the initial data exploration, I created a few simple charts to explore this data. I’ll leave a full exploration of EXIF data for a later post.
Two EXIF data points are worth mentioning now though: shutter speed and aperture. These are two settings used to control for situations of where you need to take a photo faster/slower (shutter speed) or in a bright or dark place (aperture). Unlike manual camera, our mobile phones largely take photos on auto. This means the settings when the photo was taken can tell you about the situation you were in.
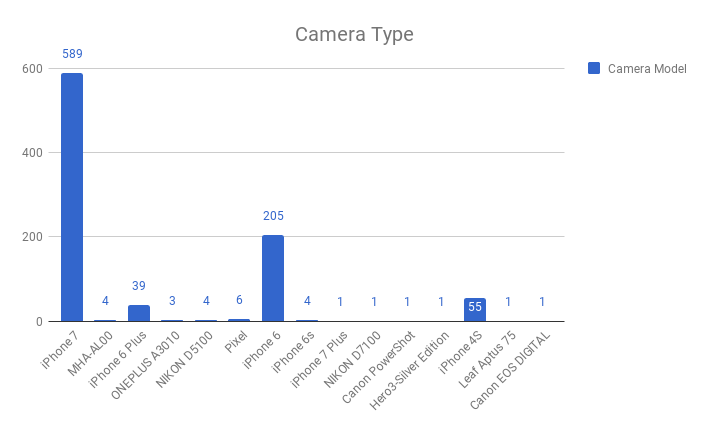
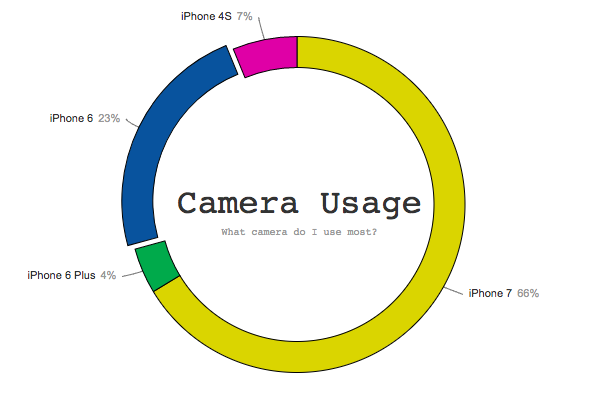
I was surprised to find that EXIF data also contains a number of records on the camera itself. This makes it possible to know what kind of camera or mobile phone was used to take photos. In my case, I’m able to see how many photos remain on my phone with each new upgrade from iPhone 4S to iPhone 6 to iPhone 7 and beyond.
Conclusion: Photos Everywhere But What Meaning in the Data?
There are a lot of photos out there today. By one estimate there were well over 1.3 trillion photos taken in 2017, and with the increase of smart phone ownership and usage, this number will continue to rise. Not only does this mean a lot of photos, but it translates to a lot of personal data in those photos.
In this post, we explored how to get the data off of those photos using an app I’m developing called PhotoStats.io. The app helps you track your photos’ metadata, export it and explore the data there. Once you have the data, you can begin to use data visualization to notice patterns.
There are a lot of ways to get data about yourself. Most of the time it involves having a wearable, installing an application or using a sensor. These tracking tools can provide information on your health, time, location, movements, surroundings and much, much more, but you need to be tracking before you can learn anything.
What’s particularly interesting about your photos as a data point for tracking is that the data is already there. You don’t need any special tracking; you just need to be taking photos.
I believe that your photos represent one of the richer data points about ourselves. There is the content of the photos that can be explored using computer vision to tell you about what’s in the photo, where you are, and much, much more. This is still cut-edge technology. Similarly, the metadata on your photos can reveal many things like when, where, and under what conditions the photo was taking. This is the primary topic of this post.
All combined this photo data might be the most unified data point we have on people today. Whether or not you are an obsessive self-tracker like me, the first thing your photos can do is tell a story. It can tell you about certain aspects of your life and behavior during, before and after photos were taken.
Beyond the data story, I believe photo data along with other tracking data can help us optimize our lives. We can be healthier, more productive and even happier. These technologies are new and changing, but already data and machine learning are changing our lives. Hopefully PhotoStats.io can help you gain access to another personal data, and its continued development can help build something amazing!
What can you learn from the data on photos? What can your photos tell you about you? Leave a comment with your ideas!
