
Ever tried assembling a puzzle without the image on the box?
Without a traction or KPI dashboard, decision making is more often than not based on intuition, luck and guessing. A guiding view of your metrics allows you and your team to lay the puzzle peices on the board, gain a perspective on the bigger picture over time, and start to iterate and experiment towards a business model and growth engine that fits end-to-end
Data-driven dashboards serve as that coveted puzzle box image. They provide clarity into what’s happening across marketing, product, operations and sales. They help you learn and act quickly as you run traction experiments, build and optimize your product, and grow. Data-driven dashboards provide direction. They act as your growth compass in the complex, uncertain world.
How much growth did you get last week? How are users engaging? What messaging or value proposition best moves our potential customers? How did a recent change in our ads or website copy affect the number of visitors, their behavior, or our conversion rate? How effective was our last compaign compared to this current one? How is our digital marketing working?
These are all data-driven questions about your marketing and product that you can and should be able answer with your data-driven dashboard.
When it comes to traction hacking and product development, a data-driven dashboard is a dynamic visual interface that brings together a startup’s crucial growth metrics, user behaviors, and product insights. Built for rapid decision-making and displaying most meaningful KPIs, it empowers growth marketers, product developers and leadership to quickly evaluate traction experiments, refine product features, and harness growth opportunities, all based on real-time data.
In today’s digital era, intuition and guessing won’t suffice for building a business. Whether it’s finding your first customers, understanding your core value proposition and messaging or deciding what gaps to focus on, a dashboard along with a robust iterative, data-driven approach to digital marketing and product have become indispensable.
I’m a data-driven growth hacker. Amongst various product and engineering roles, I have also worked extensively on the growth and data side at several startups and companies. Over the past couple years I’ve lead growth and marketing at several early-stage companies, including a healthtech app, two life science startups, a tour operator, an ecommerce shop and even a couple of of my own businesses and creative pursuits.
No two businesses are alike, and assembling all the interconnected pieces to improve growth and product is an iterative, creative process. Along with various mental models for data-driven growth hacking, I have come to see the data-driven dashboard as an indispensable compass to navigate and guide us on these vast oceans towards growth and product-market fit.
In this post, let’s explore the world of data-driven, KPI, traction dashboards and their role in growth hacking and product development. We will look at “dashboarding” and core components and anatomy of most data-driven dashboards. Then we will look at the practical usage of traction dashboards for tracking the state of a business and for running and managing traction hacking experiments. I’ll teach you how might a dashboard give you a readout on the current status of your business (or parts of one) over time as well as enable you to understand and navigate the results of your traction and learning experiments.
A captain doesn’t just rely on intuition or the stars to navigate the seas; they rely on a precise compass. In the vast ocean of marketing, growth, product, and data, let’s discover your data-driven dashboard can become an indispensable growth compass.
Let’s dive in and start navigating together
NOTE: This post is part of a blog series on growth hacking.
[Brief Aside] Data-Driven Growth Hacking 101
Before diving into the mechanics and usages of a data-driven dashboard, let’s look briefly at what is data-driven growth marketing. For a fuller picture, check out Data-Driven Growth Hacking: An Experimental, Iterative Approach to Finding and Acquiring Your First Customers.
I define growth hacking as a customer-centric, data-driven, experimental, iterative approach to creative digital marketing.
- Customer-centric means that understanding, reaching and serving is at the center of nearly everything you do. Initially this is manifested in talking to customers and user interviews. As you launch and hone your service it’s about finding ways to measure customer success and customer satisfaction
- The standard definition of data-driven is using data to inform and make decisions. I believe a better way to frame this is: Using 1. data and 2. scientific research to inform and empower our decisions and actions
- Experimental means running experiments that test assumptions, validate your business thesis (typically your core value proposition(s), messaging and benefits), and hone different ways customers become aware, consider, purchase and/or use your service or product. Fundamentally it’s about de-risking your business, learning and decreasing uncertainty.
- Iterative stands for the repetitive and repeated process of running experiments (i.e. making changes or trying campaigns), considering data readouts and deciding success and failure. Rinse and repeat. It doesn’t mean continually working on everything; it means focusing on individual parts and making improvements that improve metrics.
- (Digital) marketing entails using any number of traction channels to reach your customer, convert them into a lead and get a conversion or sale.
Harnessing the power of data lies at the heart of modern growth marketing. This approach emphasizes capturing a holistic and end-to-end view of your customer journey, from their initial interaction with your brand to the eventual sale and beyond. Through iterative growth experiments, the objective is to decode, understand, and optimize the pathways that lead customers to your doorstep.
A robust data-driven approach enables businesses to keep their fingers on the pulse of essential metrics. By meticulously tracking marketing endeavors and conversion rates, companies can craft a sales funnel that offers clarity on their business dynamics. This clarity unveils repeatable growth mechanisms ripe for fine-tuning and optimization. The true value, however, is unveiled when businesses have granular data pinpointing every critical juncture in the sales funnel - from the moment a potential customer discovers your product to their transition into a loyal patron – as well as the behaviorial metrics to see how they are engaging with your product or service.
In practice, this data-centric approach means diving deep into the analytics of ad clicks, engagement metrics on your platforms, and crucial conversion points, be it a simple newsletter subscription or a significant purchase. The culmination of these efforts is typically manifested in a cohesive data-driven traction dashboard. This dashboard provides a panoramic view of campaign performances, user behaviors, and pivotal KPIs, consolidating everything from signups to revenue streams in a single, comprehensive platform. In practice this might start with a smaller, ad-hoc dashboard that examines and helps you understand a single step in that journey.
What is a data-driven dashboard?
Traction and growth are essential to any business. Whether you are an ecommerce shop, an online side hustle or even a proper startup, it’s important to track your growth over time and the key mechanisms that drive traction like engagement, growth and sales. By tracking your marketing and conversion metrics, you can monitor the core numbers that drive your business and, in turn, create a sales funnel that helps you see and break down your business into repeatable growth engines you can iterate on.
Data-driven dashboards are powerful tools that provide businesses with real-time insights and direction. From capturing comprehensive data that informs the current state of marketing, sales, and product development, to facilitating a deeper understanding of traction experiments, traction dashboards enable individuals and teams to make informed decisions. Furthermore, having dashboard with real-time data can help you think and reflect better about your customers, marketing, operations over time, and ultimately deliver a better user and customer experiences end-to-end.
So, what is a data-driven dashboard?
A data-driven dashboard is a visual representation of data, designed to track various metrics in real-time or over specified periods.
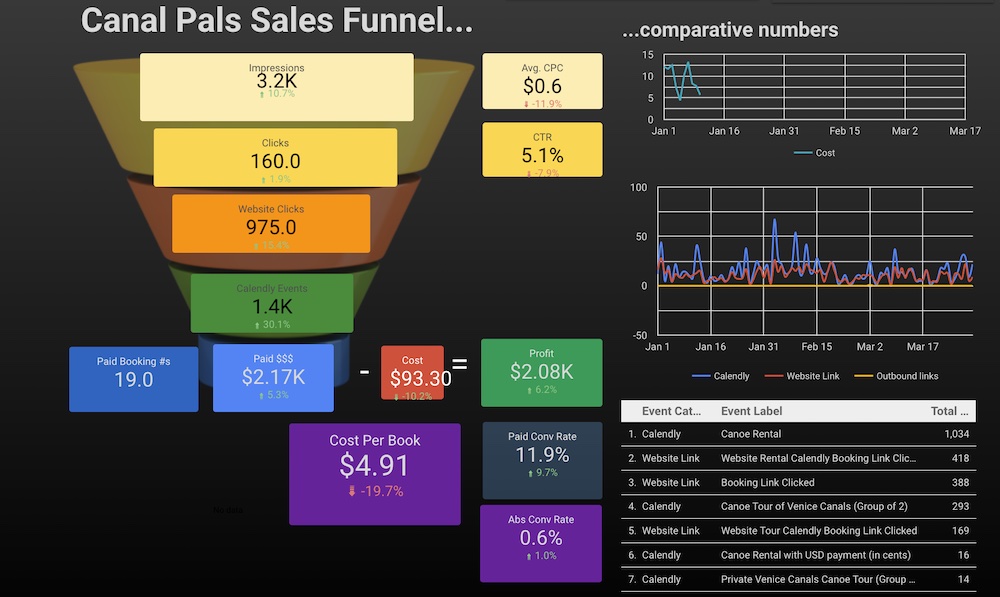
Example of a Simple Sales Funnel Dashboard.
Put simply, a dashboard is a tool used to present information. It typically helps an analyst or business executive quickly understand the state and status of a business, a machine or some other informational data stream. It also helps with decision-making.
Dashboard can provide a growth compass to help you navigate and decide over time too. There are many types of dashboards, even outside of growth and product development. A few examples:
- Operational Dashboard - helps show functionality of a system or process
- Business Dashboard - often used to understand financies, sales, profit/loss, etc.
- Startup Metrics / Growth / KPI Dashboard - core focus on this blog post
- Executive Dashboard
- Project Dashboard - used to track design, engineering and other teams in planning and executing of a medium- to long-term initative.
There are endless potential ways to build a dashboard. The two core aspects are:
- Data Sources: Basically what data are you tracking around your product, service or operation. This might might include data such as web analytics, social media metrics, CRM, app behavior, sales numbers and more
- Visual Display and Interactivity - Depending on data and way you want to see and iterate with it, your dashboard will commonly include widgets, charts, graphs, and KPI indicators. Drill-downs, filters, and data slicers enhance the one’s ability to explore data and track your experiments and campaigns.
There are many tools you can use to build an integrated traction data dashboard, including paid, open source, and/or free options. My current favorite (and free) option is Google Data Studio / Looker. It works great and integrates seamlessly with Google Analytics, Firebase and Google Ads, three key pieces I often use tracking and hacking traction. I have also had good success with Tableau, Mixpanel, Segment.io, Kibana, and Amplitude.
While there are lots of approaches and tools, ultimately, dashboards are fueled by the questions they intend to help answer and track. For growth marketing and product development, the central concern is how to improve our traction and growth KPIs, because, as founder of DuckDuckGo puts it, traction trumps everything.
How dashboarding drives modern decision-making, growth hacking and product development
As a team or company pursues scaleable and repeatable traction, dashboards have become an indepensible tool.
As we navigate the evolving landscape of marketing, customer needs and product features, “dashboarding” has emerged as a guiding and orienting compass. They help us see trends from the past and decide on success, failure and learnings of current initives.
Here are the key ways that dashboarding help us “chart” a path foward.
- Timely, Real-time Insights: The ability of dashboards to provide real-time data allows businesses to make appropriate decisions. You no longer have to wait until the rare read-out, analysis or report since anyone can jump into the dashboard and track how key metrics are moving.
- Consolidation: It’s easier than ever to track our businesses and each of the tools we use often create separate data points. Dashboards consolidate data from disparate sources, providing a holistic view and eliminating the need to juggle multiple platforms. They also make it possible to map a user journey from ad or traction channel to our website, product and/or service.
- Transparency & Accountability: Dashboards allow a leader and team to track their performance metrics and see how changes are working (or not). By fostering a culture of accountability, you can iteratively make improvements and make appropriate choices.
- Customized KPIs: Every business is unique. Your dashboard when combined with an understanding of core activities and metrics that move your business can ensure you’re driving towards the unique needs and KPIs of your business, ensuring relevancy in the data displayed.
Furthermore, dashboards can be shared and customized across a team or organization, promoting collaboration and collective decision-making based on shared insights. They also allow non-data folks to follow key aspects of business too. Everyone can be involved in identifying opportunities and derisking too, since dashboards provide a shared end-to-end view of what’s happening through data.
Traction Dashboard Use Cases
Now that we’ve looked at what is a dashboard and some the benefits, let’s look at a few specific use cases and key qustions, namely:
- How is my business/product/marketing doing holistically over time?
- How did my latest traction experiment or growth initiatve go? What am I seeing? What did we learn?
- How are customers using my product? Are any parts in the process underperforming? How might I prioritize develop according to product data?
Let’s examine a few of these questions through a two specific dashboarding use cases.
Tracking the State of the Business with Your Traction Dashboard
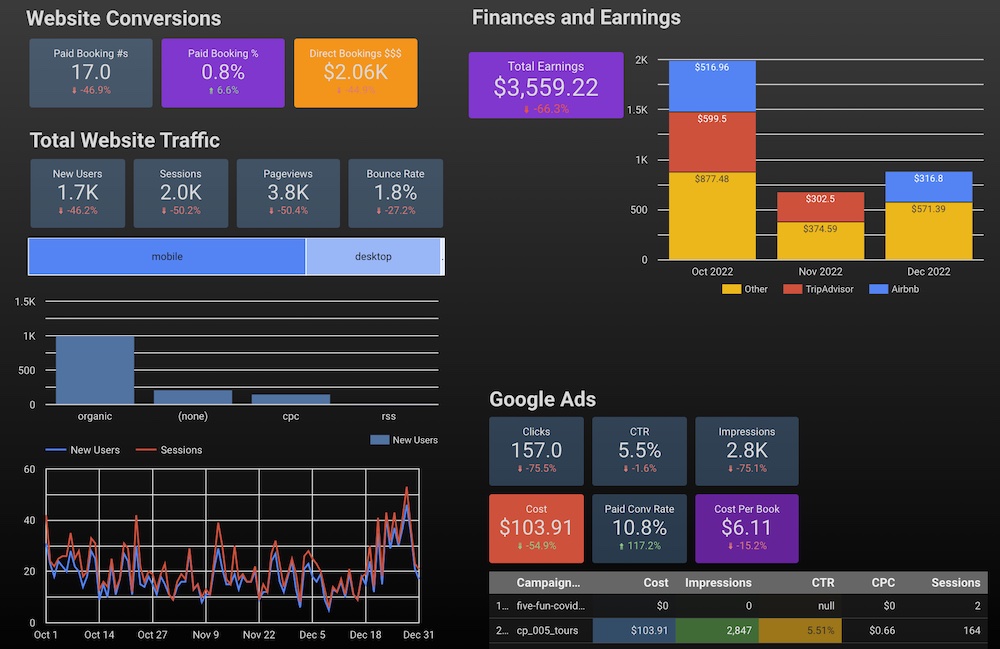
Example of a Traction Overview Dashboard. Note how certain KPIs are colored to indicate importance.
Oftentimes businesses and products lack a holistic view of what’s going on. A data-driven traction dashboard can provide a comprehensive snapshot of your startup’s current state, highlighting its strengths, weaknesses, opportunities, and issues in real-time using data.
One of the most common initial tasks I take on when doing digital marketing and growth hacking for companies, clients and startups is the data audit. Basically I look at various streams of analytics and data capture to see what’s going on and possibly seek out opportunities to “lift” the business, marketing or product numbers. For new businesses, I’ll set up and build all of these for scratch. But oftentimes I’m piecing together and sleuthing existing data streams.
Data has become pretty ubiquous in modern tech products. Many businesses have good data coverage related to the individual parts of their business, like marketing, product or sales. But the data streams are often disconnected, and it can be difficult to tell what’s going on when it’s fragmented and your user or product journey is spread across so many touchpoints and services. Unfortunately data capture alone isn’t enough to understand your business or drive meaningful change. You need to piece it together.
In order to facilitate a move towards more data-driven growth marketing and product development as well as ease my data audit and analysis, I typically start by building a general purpose data dashboard. Initially during a data analytics audit, I’m pulling together as much meaningful data as I can. This means bringing together marketing and ad spend data with what’s going on with analytics of landing pages and app behavior from inside the app or product.
By pulling disconnected data together, we can start to tell a connected, end-to-end story, showing us how we are doing overall and potentially see issues and opportunities at specific points.
Every business is slightly different, but a typical “state of the business” traction dashboard includes key growth metrics like:
- Traffic - How many potential customers and other visitors are coming to our site, viewing our app store listing or opening our product store? Often expressed in terms of new and existing users, page views and/or time spent, these metrics are broadly related to usage and awareness and are an initial component in capturing attention, building momentum and growing.
- Customer Acquisition Cost (CAC), i.e. how much does it cost to acquire a customer or get a sale? This is in most businesses your single most important indictator. If it costs you $100 for a product that sells for $50 dollars you are in trouble. But if it costs $100 for a $25 monthly service, then there is potential, especially if you can convince customers to stick around for months or years.
- Conversion Rates: End-to-end you want to measure the effectiveness of your awareness and sales funnels and identify potential bottlenecks. Metrics could include cost per impression, cost per click (CPC), cost per install (for a mobile app), or other conversion and engagement metrics, like signup for a newsletter or free ebook. Conversation rates are often at heart of your sales funnel.
- Revenue/Sales, i.e. how much are we earning? Typical examples: Monthly Recurring Revenue (MRR) and Annual Recurring Revenue (ARR).
- Subscribers and daily/monthly/yearly users - After the initial core conversion, your subscriber count can be a big part of many business model and likely integral to your traction dashboard
- Churn Rate or customer retention - How many users are you losing over time?
You might also include Lifetime Value (LTV), Burn Rate, or Ad Spend.
Generally speaking a good traction dashboard will track and breakdown growth in terms of different traffic and traction channels (like source of install or initial cpature) as well as the effectiveness of specific growth experiments and campaigns (like facebook ads vs google search ads). Being able to filter by channel or source, allows you to compare which traction channels perform best for your business or service.
Assuming a business already has had these data streams, then assembling your first centralized traction dashboard will allow you to do a few different activities almost immediately:
- Display all of this data into clear visalization, allowing you to simplify complex data and make it easier to communicate the startup’s status.
- Because you have a bunch of data streams together from the past, you should be able to track performance and compare it over time. This alone might showcase progress, areas of decline, or what you missed in terms of tracking in the past.
- Because dashboards simpify and centralized your metrics, they make it easy to communicate with stakeholders including leadership but often just importantly with current and future investors.
- Because I often like to include filters, it immediately allows different teammates and stakeholders to explore the data on their own. This engagement will allow them to tell you about past trends they see and push you to build adaptability and flexibility into your dashboard to serve the organization’s needs.
Unfortunately, I’ve encountered numerous founders and startup teams drowning in data, yet struggling to cohesively present it in a straightforward, comprehensible dashboard. While accumulating data can seem like an accomplishment in itself, without merging insights from marketing, sales, product, and other sectors into a cohesive “state of the business” traction dashboard, your data remains merely a scattering of isolated points. Instead of disjointed dots, envision laying out the puzzle pieces into a cohesive map driven by a guiding growth compass.
In practical terms, your comprehensive traction dashboard becomes an easy-to-use reference on how you are doing across different time periods and according to different key metrics. By establishing vital KPIs and consistently dashboarding the state of your business, you empower yourself and your team to navigate the complex terrain of growth, marketing and product with and through data.
Dashboards not not only simplify your data and your decision-making but also foster transparency and accountability. They, as we will see in the next section, can help you glean insights from experiments and learn what drives your customer, marketing and product. Dashboard often lay the groundwork for a culture of fearless data-driven experimentation.
Traction Hacking Insights: Dashboards at the Helm of Finding, Learning, and Growing Your Traction Channels
Traction Experiment Ad-Hoc Dashboard: See how it layouts data points and conversion points to showcase end-to-end journey.
Existing business often have much less uncertainty than a new startup or new business venture. Whether you are on the unpredictable journey of startups or an existing business, having a data-driven anchor
Established businesses usually face less uncertainty compared to fresh startups or new entrepreneurial ventures. Regardless of whether you’re navigating the unpredictable waters of a startup or steering an existing enterprise, a data-driven approach and a traction dashboard can serve as a reliable anchor. It ensures that your decisions are well-informed, effort and initiatives are tracked, and every steps marks a decisive stride towards learning and your ultimate vision of success.
Crafting a holistic, end-to-end traction dashboard is always at the forefront of my mind when I embark on new marketing and growth hacking initiatives. It’s a goal I try to prioritize from the get-go, but developing this dashboard is often a gradual process, spanning several weeks or even months. In the fast-paced world of growth and marketing, we seldom have the privilege of waiting until every piece of data is curated, every tracking mechanism is perfected, or our comprehensive dashboard is fully operational before we need to dive into new traction experiments to fix or grow a business venture.
Given these constraints, I rarely finish a comprehensive traction dashboard before I need to dive into launching something new. So, instead of striving for an exhaustive traction dashboard right off the bat, I try and target early learning-oriented and impactful interventions. Practically-speaking this means strategizing a tractical approach based on my initial data audit and data analysis and devising a light-touch, high-impact opportunity to help us quickly start learning and iterating.
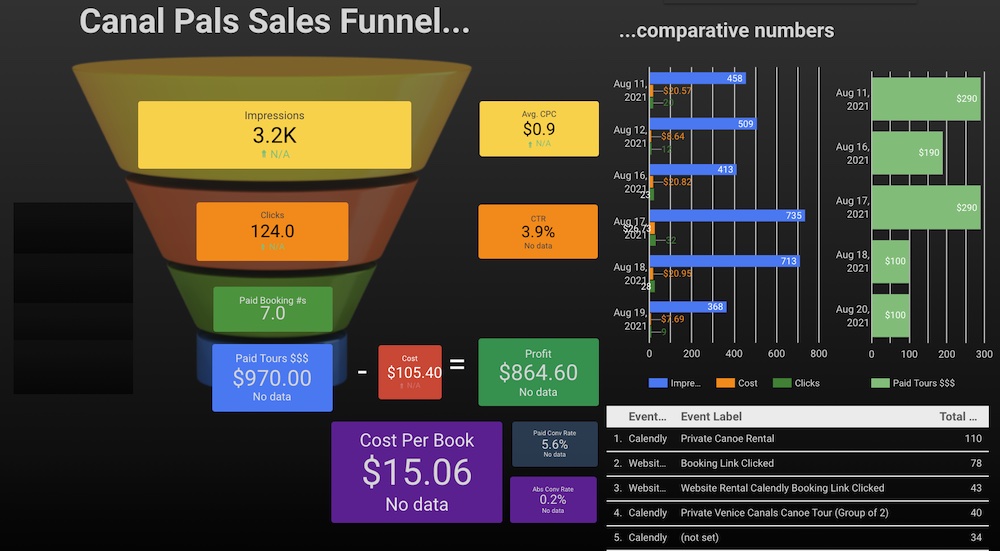
Traction Experiment Ad-Hoc Dashboard, which was used to iterate several ad and landing page experiments and drive a sustainable traction channel.
Since comprehesive analytics requires integrating too many pieces, I’m often not looking to track the end-to-end but instead to “hack” or optimize a single compoment. By honing in a particular key touchpoint or conversion point and ensuring we track it judiciously, we can get up and running quickly and start learning and improving too.. For example, it might be A/B testing a top-of-funnel ad channel with two value propositions or could be trying a simplification of the messaging on the app or landing page. The goal of an initial traction experiment is be purpose-driven, test key systems for early data cpature and just get started.
I refer to these as “Ad-Hoc Traction Experiment Dashboards,” purpose-built tools tailored to capture specific insights from individual growth experiments or specific touchpoints. By focusing on real-time data pertinent to each unique initiative, they enable us to make informed decisions swiftly, optimizing our strategies and driving results even in the early stages of our growth journey. The objective isn’t to get lost in the weeds but to highlight exactly the key KPI or mover of that campaign or initiave.
While this initial, more agile approach may seem less than ideal, it offers a multitude of advantages. For starters, ad-hoc traction dashboards aligns perfectly with the growth hacking ethos: quick iteration, testing hypotheses, and rapidly adapting based on real-world feedback. By leveraging a streamlined, focused dashboard for individual experiments, we can swiftly discern what’s working and what’s not, allowing us to learn quickly and optimize strategies accordingly.
What kind of traction experiments work well or are ideally suited for this approach?
Ad-Hoc Traction Experiment Dashboards thrive when applied to endeavors that demand rapid feedback loops, quick adjustments, and a lean approach. They are especially effective for experiments where granular data, even if limited in scope, can provide actionable insights to inform immediate strategy tweaks. The agility of this approach means it’s particularly well-suited for:
- Core Value Proposition Testing: When you have competing visions for what moves your customers or why they care, you quickly figure out what resonates and what doesn’t.
- Traction Channel Testing: Can you get new users or customers from facebook, google ads or some other traction channel?
- Landing Page Optimizations: Modifying page design, content placement, or user flow to maximize conversions.
- Early-Stage Product Launches: From concept testing to testing minimum viable products (MVPs) in a real-world environment to gather initial user feedback and usage patterns.
- Content A/B Testing: Comparing different headlines, visuals, or call-to-actions to identify which resonates more with the target audience.
- User Onboarding Experiments: Tweaking the onboarding process to observe its impact on user retention and engagement.
There is really no limit to tactical areas you might apply light-touch, high-impact iterative growth hacking experiments. For example:
- A social media experiment running short-term campaigns on platforms like Facebook or Instagram to test different ad creatives, audience segments, or promotional offers.
- An email marketing Strategy to determine open rates, click-through rates, and conversion metrics for different email templates or subject lines.
Interestingly enough not all of these even require you to build out a much of a dashboard since in some cases a single KPI or conversion rate might be enough to learn, iterate and act.
That said, I personally believe a “mini dashboard” for small experiments forces you to start pulling data into your dashboard and provides invaluable insights that contribute to the development of the comprehensive traction dashboard down the line. Each experiment, with its own set of tracked metrics, offers a piece of the larger puzzle. Over time, as more experiments are conducted and more data is gathered, these pieces naturally coalesce, forming a detailed, panoramic view of the startup’s growth trajectory.
This approach is not just about being pragmatic—it’s about being proactive. It fosters a culture where data and insights drive actions, even when the full picture isn’t yet available. Rather than waiting on the sidelines for the perfect dashboard, we’re in the thick of things, extracting value from every byte of data, every user interaction, and every pivot in strategy.
In short, by harnessing the power of Ad-Hoc Traction Experiment Dashboards, startups can navigate these experiments with precision, ensuring that every move is data-informed and every effort yields maximum learning and maxium impact.
Conclusion: The Ultimate Vision: A real-time, data-driven, end-to-end view of your business operations
As Albert Einstein once said, “Insanity is doing the same thing over and over and expecting different results.”
Intuition and best guesses no longer suffice in modern digital enterpreises. Data is everywhere, and it’s not just about capturing it. Instead, it’s about harnessing every byte of data, every user interaction, and learning from it. By weaving your data into a cohesive, real-time tapestry through a data-driven dashboard, you can depict the story of your business and act accordingly. You can equip yourself, your team and your business with a growth compass.
A traction data-driven dashboard gives you a readout on the state of your business over time as well as enables you to understand the results of your traction and learning experiments.
Personally I’m a huge believer in dashboards, and, as a quantified self self-tracker, I have applied them to not just growth and product to aspects of my personal development too.
In this piece, we’ve journeyed through the importance of data-driven decision-making and the power of traction dashboards. We specifically looked at two types, the comprehensive traction dashboard and the ad-hoc traction dashboard. One points us towards a clear vision of core KPIs over time. The other enables practical growth initiaves focused on more singular data readouts and numbers. While we referred to them separately, they are at their core two ends of what I believe should be positioned as data-driven growth hacking process wherein we gain a picture of the whole as we iterate and hack on the parts. Tied together, they help us better decipher, decide, and drive
At the heart of all these endeavors is a singular vision: to achieve a real-time, data-driven, end-to-end view of your business operations. Such a perspective not only illuminates the present but also anticipates the future. It ensures that your decisions are data-driven yet proactive, your strategy is optimized yet opportunistic, and your approach to growth is iterative yet always open to learning more.
AIDA (AI Disclosure Acknowledgement): The following written content was written by me with the assistance of an AI-based system (ChatGPT). Specifically I used it to help me in some aspects of the pre-writing phase, research, copyediting and drafting a few individual points including my primary metaphor (navigational compass).